Emerging market life cycles
An assessment of country cycles in 2026

This is a free-to-read edition of Asian Century Stocks – a newsletter about Asian value stocks. New to the publication? Sign up here. If you don't want to receive these free weekly updates, you can adjust your e-mail preferences here.
In 2002, Marc Faber published Tomorrow's Gold – a book about emerging market investing.

One of my favorite chapters discusses the life cycles emerging markets tend to go through.
Faber argued that a typical emerging market tends to go through seven phases: zero being the bottom of the cycle and three its peak:
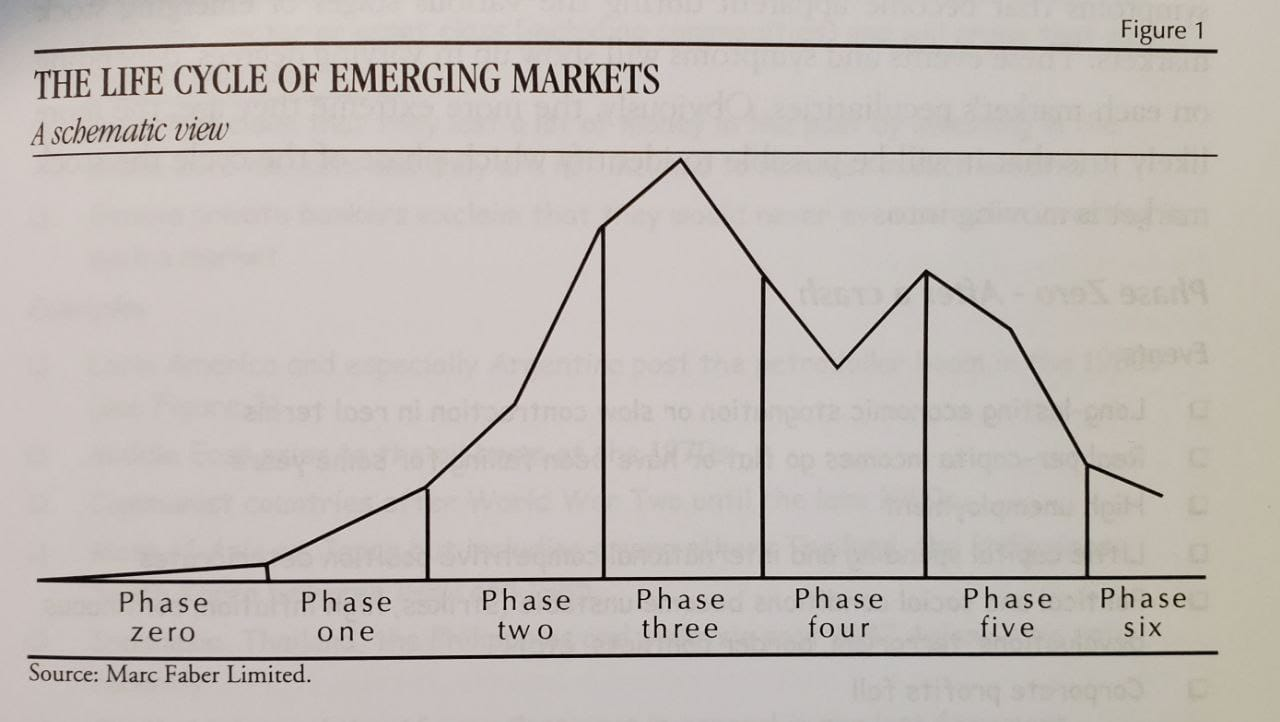
These phases are characterized by levels of economic conditions, employment, construction activity, credit creation, real estate prices, inflation pressures, trading volumes, valuation multiples, research coverage, IPO activity — and, lastly, sentiment.
In this post, I'll go through what each of the seven phases looks like. Then I'll try to fit each Asian stock market to the template to help us understand where it is in its respective cycle.
Phase 0 – after a crash
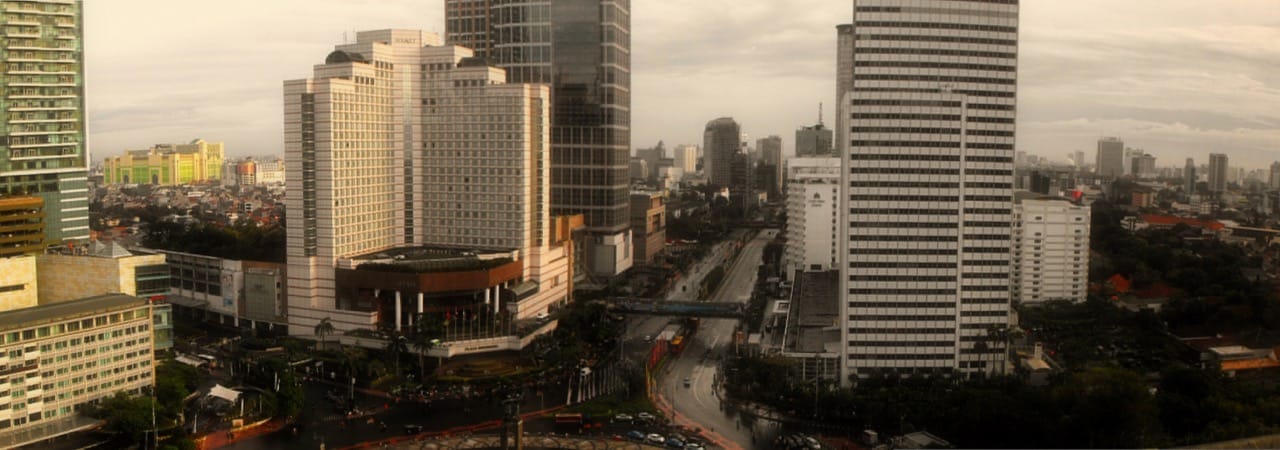
In "Phase 0 markets", economic conditions tend to be weak. There's been a crash of some sort, and there's gloom & doom in the investor community. A recession has driven the unemployment rate high, and GDP growth has been weaker than expected. Credit creation remains weak, partly due to bad loans racked up in the previous cycle.
And that weakness is reflected in low investor interest. Trading volumes can be incredibly low, often down 90% from the peak. The stock market may have traded sideways for years, building a base. But foreign investors remain absent from local investor conferences. And the disinterest is also reflected in low valuation multiples. While value investors agree that the market is cheap, they lament the lack of liquidity and the absence of an identifiable "catalyst". Even hot IPOs are having trouble finding investors.
Examples of such markets, according to Faber, were Thailand, the Philippines and South Korea in the early 1980s. Or Indonesia after the Asian Financial Crisis in 1997, when most foreign investors had already left.
Phase 1 – the spark
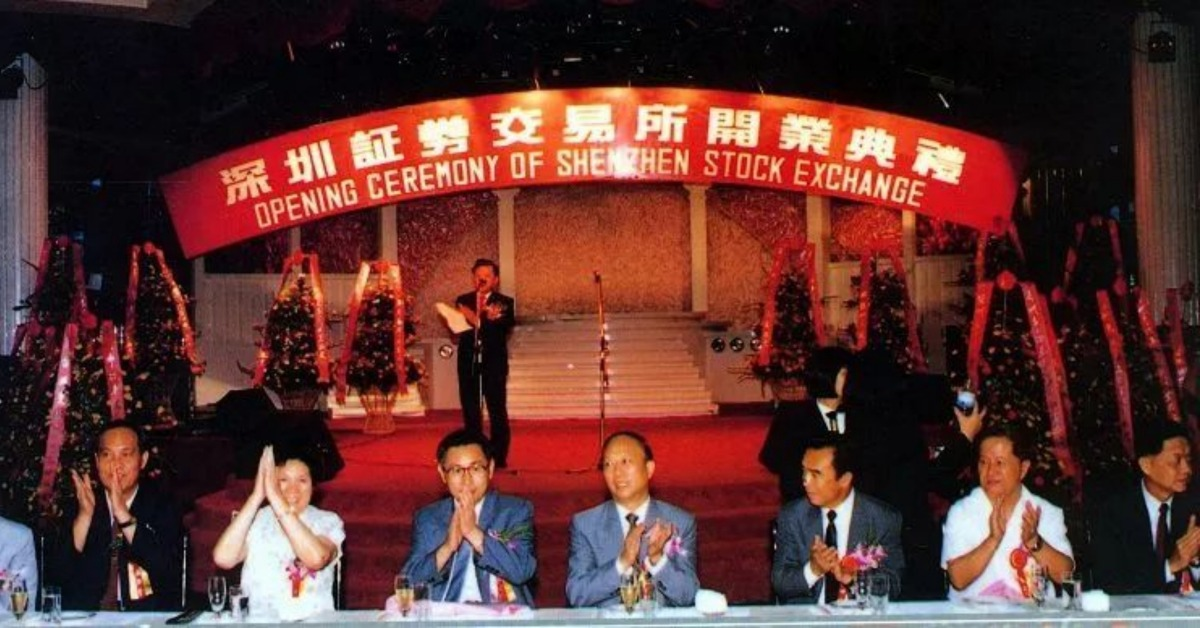
Suddenly, a catalyst drives a shift in the market: what economist Charles Kindleberger called a "displacement". It could be a new invention, a shift to private property rights, a sudden rise in exports, higher commodity prices, discoveries of new resource deposits, lower taxes, removal of foreign exchange controls, looser foreign ownership laws, etc. Anything that can cause profits and productivity to rise. Because of the profits to be had, businessmen slowly return to the country, causing hotel occupancy rates to rise to, say, 70%.
In Phase 1 markets, we often see a surprising increase in stock prices. A few contrarian fund managers start to invest. And insiders are buying stocks, or privatizing their businesses at low valuations. As borrowing demand increases, credit conditions finally ease, and capital formation starts to rise.
The perfect example is perhaps China in the early 1990s. A few years earlier, the government had just legalized private companies with eight or more employees, causing a boom in entrepreneurship, along with stronger property rights. The result was a boom that lasted for decades.
Phase 2 – the recovery
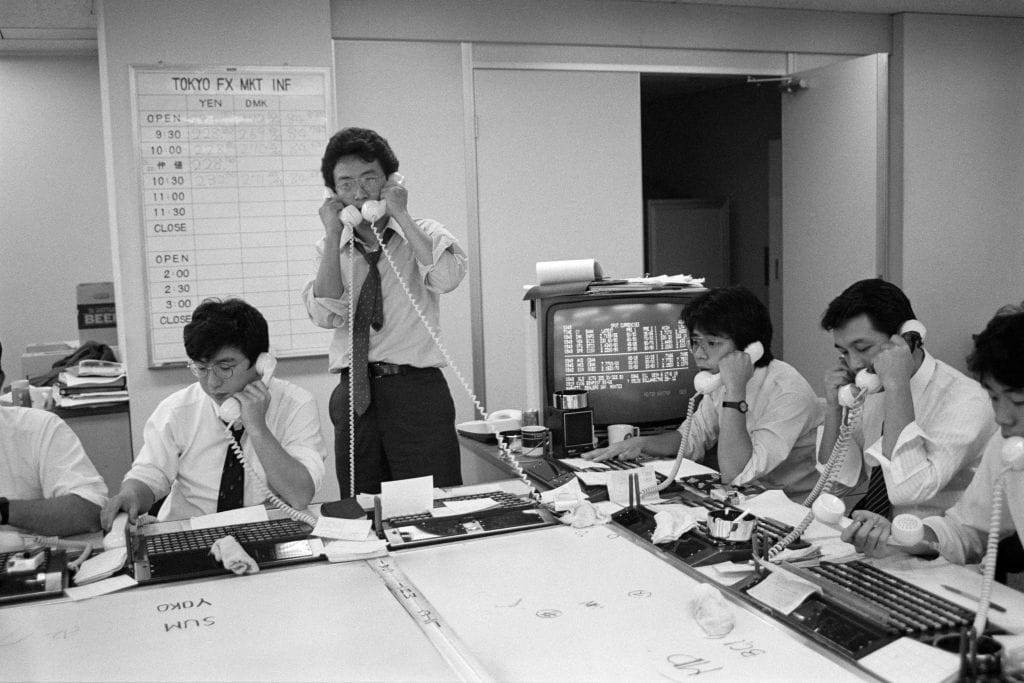
In Phase 2 markets, the economy is doing visibly better. Unemployment falls, and wages are rising. Credit creation is high, and some of that capital eventually flows into financial assets. In this part of the cycle, real estate prices often rise several-fold. According to Faber, the capital city ends up resembling an enormous construction site. Inflation accelerates, and interest rates begin to rise.
These improvements are quickly reflected in investor sentiment. Headlines in the international press start to become positive. A number of new country funds launch, and foreign inflows pick up. Hotels suddenly fill up with businesspeople and portfolio managers. Brokers issue thick research reports arguing for investing in that particular country. And as Faber argues, in Phase 2, these countries often become favorite travel destinations.
A good example is Japan in the mid- to late-1980s, when credit creation picked up and caused a long-lasting boom in land prices.
Phase 3 – the boom
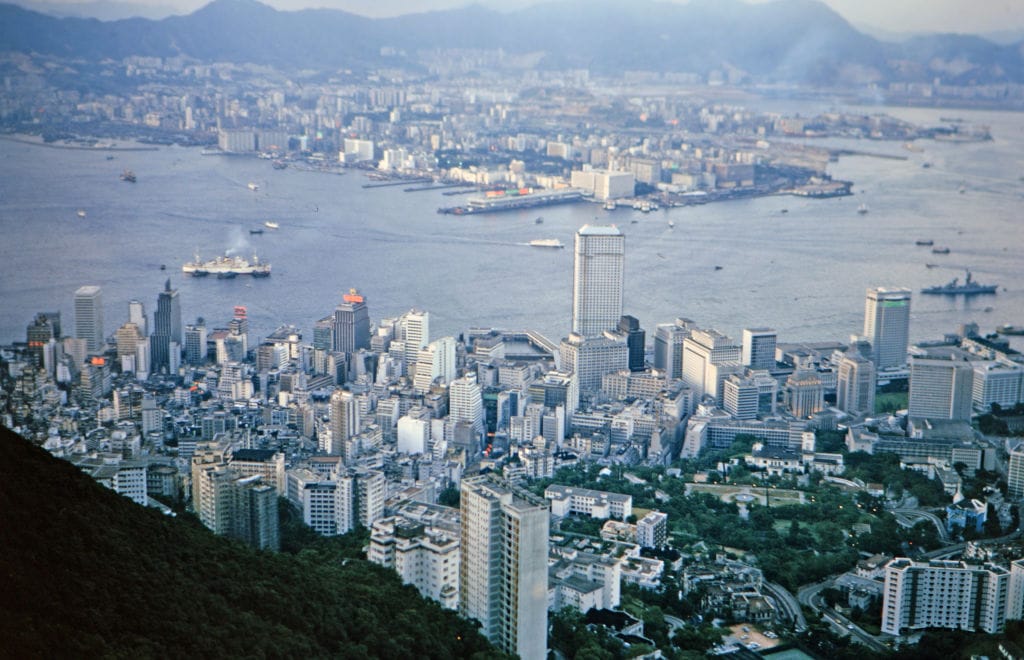
Finally, the cycle hits a peak. Overinvestment leads to excess capacity in several sectors of the economy. Wages are rising, and inflation becomes a real problem. During this phase, credit frequently grows much faster than GDP. And for that reason, stock and real estate prices become elevated. The system eventually becomes leveraged and fragile.
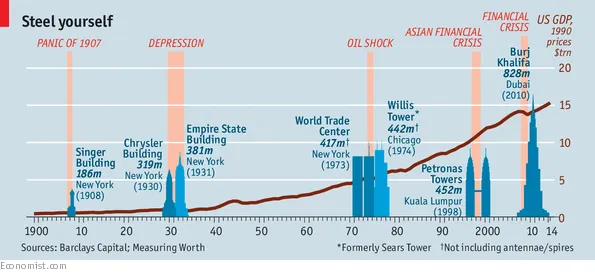
Phase 3 is when massive new skyscrapers start to get built, as Andrew Lawrence documented in his Skyscraper Index. Skyscrapers are expensive to build, and their construction often relies on easy credit. So they tend to be built during the later stages of a bull market.
During this phase, real estate and stock market speculators frequently become folk heroes, as I described in my post on the late-1980s stock market bubble in Taiwan. A new airport in the capital is often inaugurated; a second one is in the planning stages. Buzzwords like "LBO", "M&A", "BRICS", and so on, proliferate. Trading volumes hit record levels. Foreign brokers open local offices and start to publish thick research reports in the hope of getting new business. Speculators start calling companies by their ticker symbols and don't even know their names.
Amid the frenzy, concerns build up. Perhaps corporate profits are declining. Perhaps there are doubts about the scale of future investment activity. Or perhaps there's a shock of some sort, for example, a rise in interest rates, a major scandal, a business failure, or a margin call by a large speculator.
And so we reach a situation where the supply of new shares exceeds the demand for them. Smart investors and insiders take the hint and decide to take profits.
Countries that fit the profile include Hong Kong in 1973, oil-producing regions in 1980, and Japan in 1989. Booms eventually turn to busts.
Phase 4 – downcycle doubts
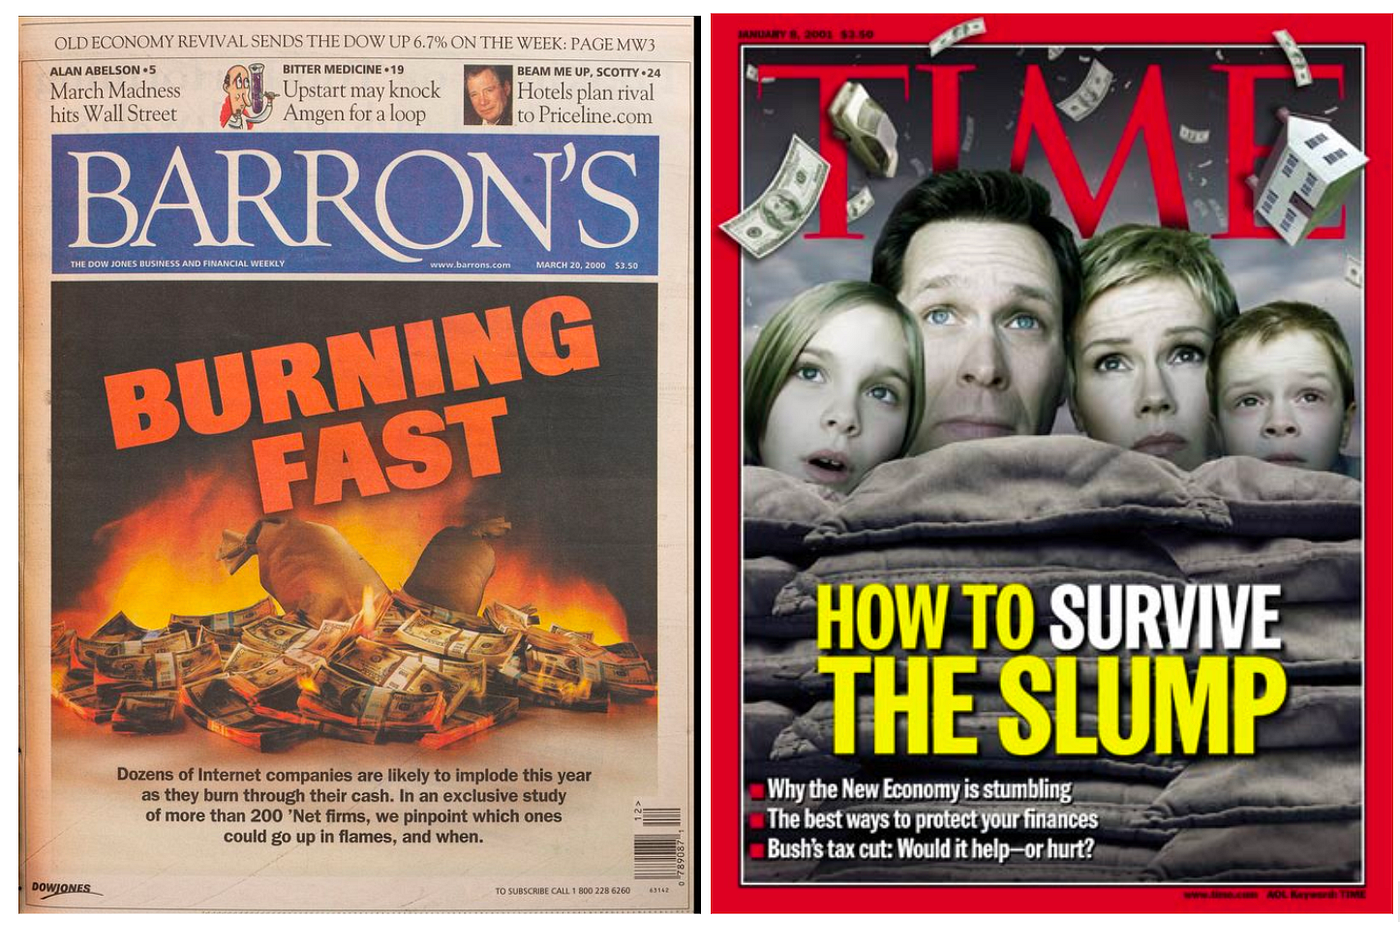
In phase 4, the downturn begins in earnest. Credit growth slows as banks tighten their lending standards. Corporate profits deteriorate. Excess capacity shows up in certain parts of the economy. And the non-performing loan ratio starts to rise. By now, office rents are falling outright. We might also see a weakening in social conditions, for example, a new political leader causing discontent or even riots.
Investors initially brush off the decline as being temporary. Sell-side analysts keep publishing bullish research reports, arguing that the decline represents a lifetime buying opportunity. But the advance-decline line shows weakening breadth.
Faber thinks that the United States in 2001 was a perfect example. By this time, the boom was already over, but every rally was powerful enough to seduce skeptics back into the market.
Phase 5 – realization
Finally, the country is in a full-on recession. Credit becomes tight, bond spreads widen, and bankruptcies soar. Consumption slows noticeably, showing up in new car sales or housing transaction volumes. Meanwhile, corporate profits collapse. And real estate prices are now falling. Large companies come under distress, forcing them to issue shares to survive. At this point, office buildings suddenly become empty, and hotel vacancy rates rise. Unemployment becomes a real issue, and the government is forced to print money to support the economy.
With these weaker economic conditions, brokers lay off staff and close down offices. Research reports become thinner. And stock prices fall, as foreigners exit the market one by one.
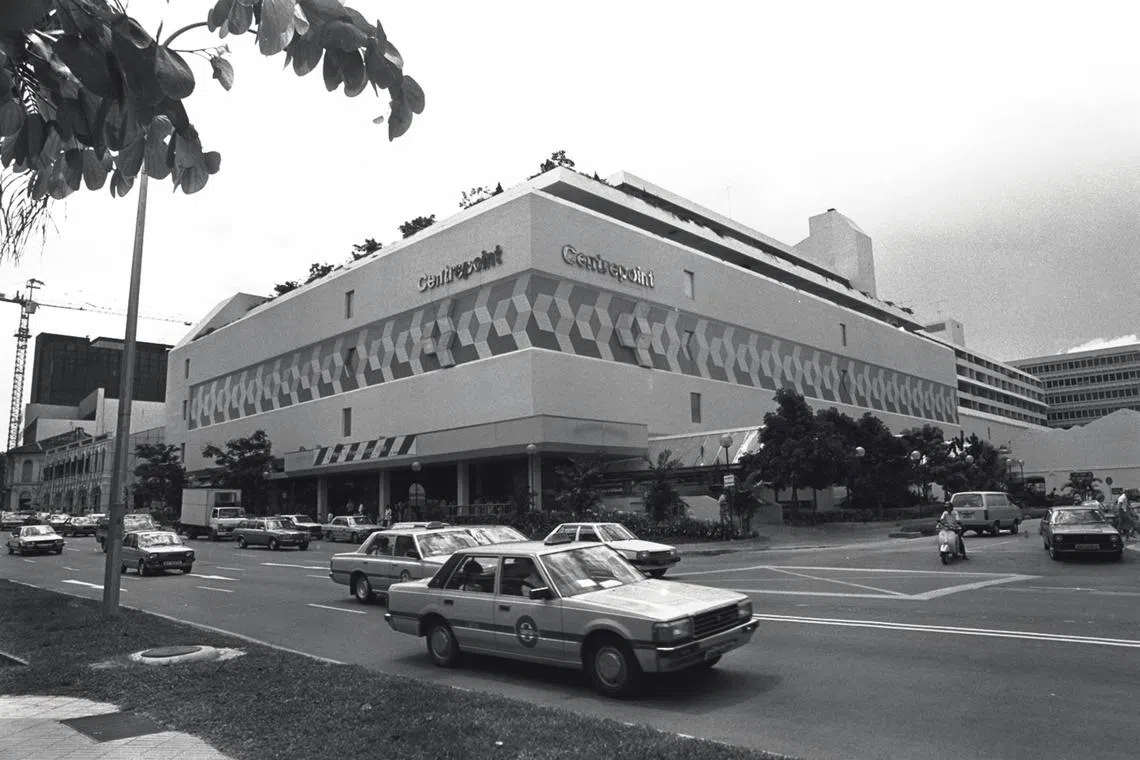
One example could be Singapore in 1985, after its epic construction boom. The economy had benefited from an accelerating HDB building program, accelerated investment in expressways, and the new Changi Airport. That boom eventually turned to bust.
Phase 6 – capitulation
Finally, investors more or less give up on stocks. Trading volumes are now down significantly from the peak. Funds often shut down altogether. The currency has already weakened or been devalued. And major headlines turn negative. Media reports how retail investors have lost money in stocks, eventually capitulating and selling to wipe the record clean.
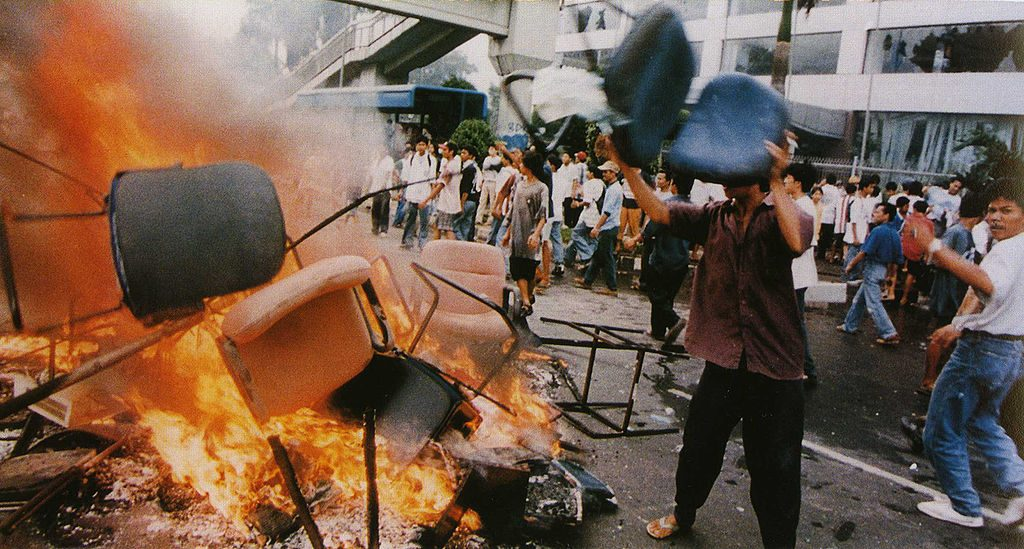
A perfect example might be Indonesia in 1998. Its downturn was short, but eventually led to a complete exit by foreign investors. With the currency down 85% against the US Dollar, and stocks down another 65%, any leveraged investors had already been wiped out. Nobody seemed interested in Indonesian equities any longer.
Fitting Faber's template onto 2026
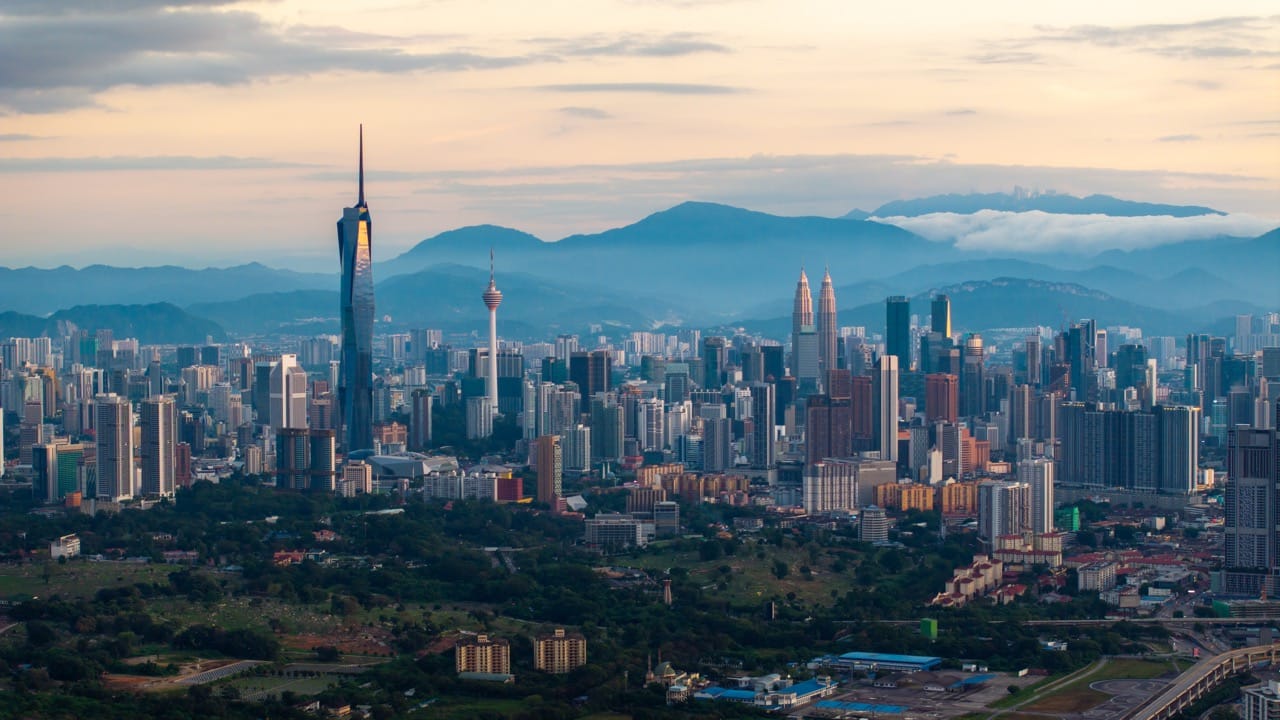
Faber's life cycle template is mostly illustrative. Few booms and busts fit perfectly. And it's not clear whether it has any predictive value for future returns.
But just for fun, I've tried to map out where each Asian stock market stands in 2026. And this is the conclusion I've reached:
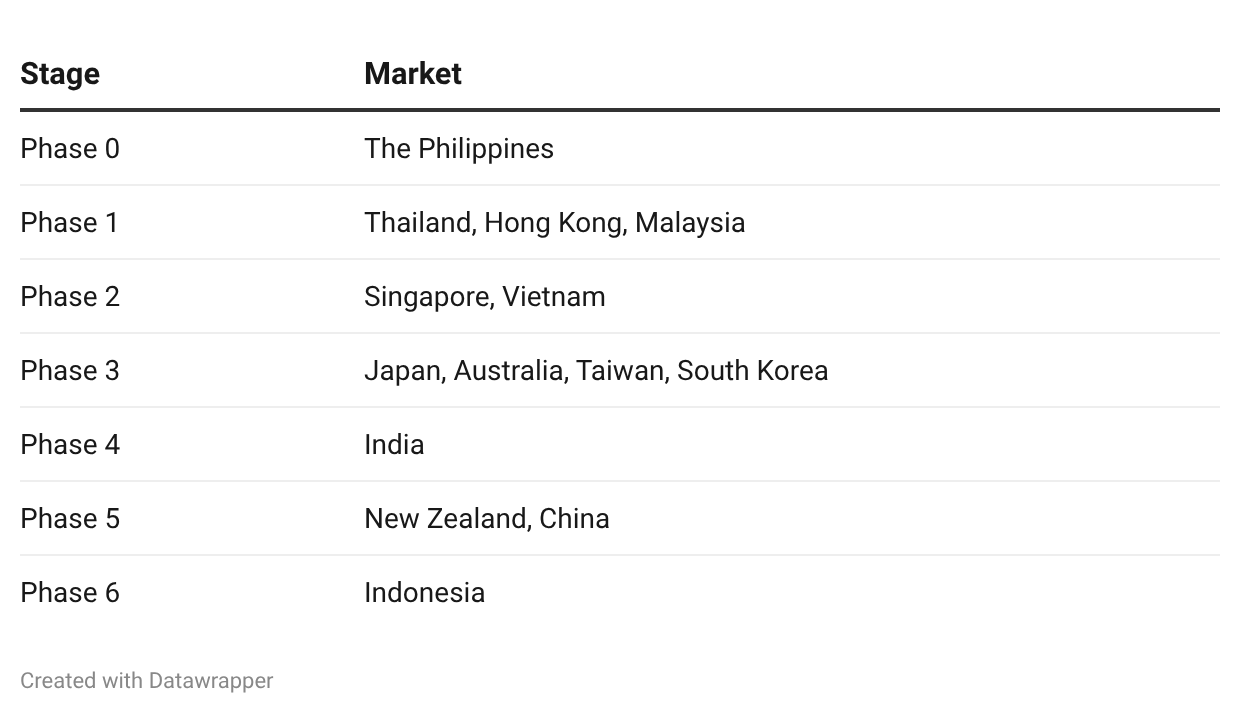
In other words, the Philippines, Thailand, Hong Kong, and Malaysia have characteristics of Phase 0-1 markets. And Japan, Australia, Taiwan, and South Korea have characteristics of Phase 3 markets.
Note: The ETF charts below are solely used as price proxies for the underlying index. I don't have a view on these particular funds.
The Philippines - Phase 0
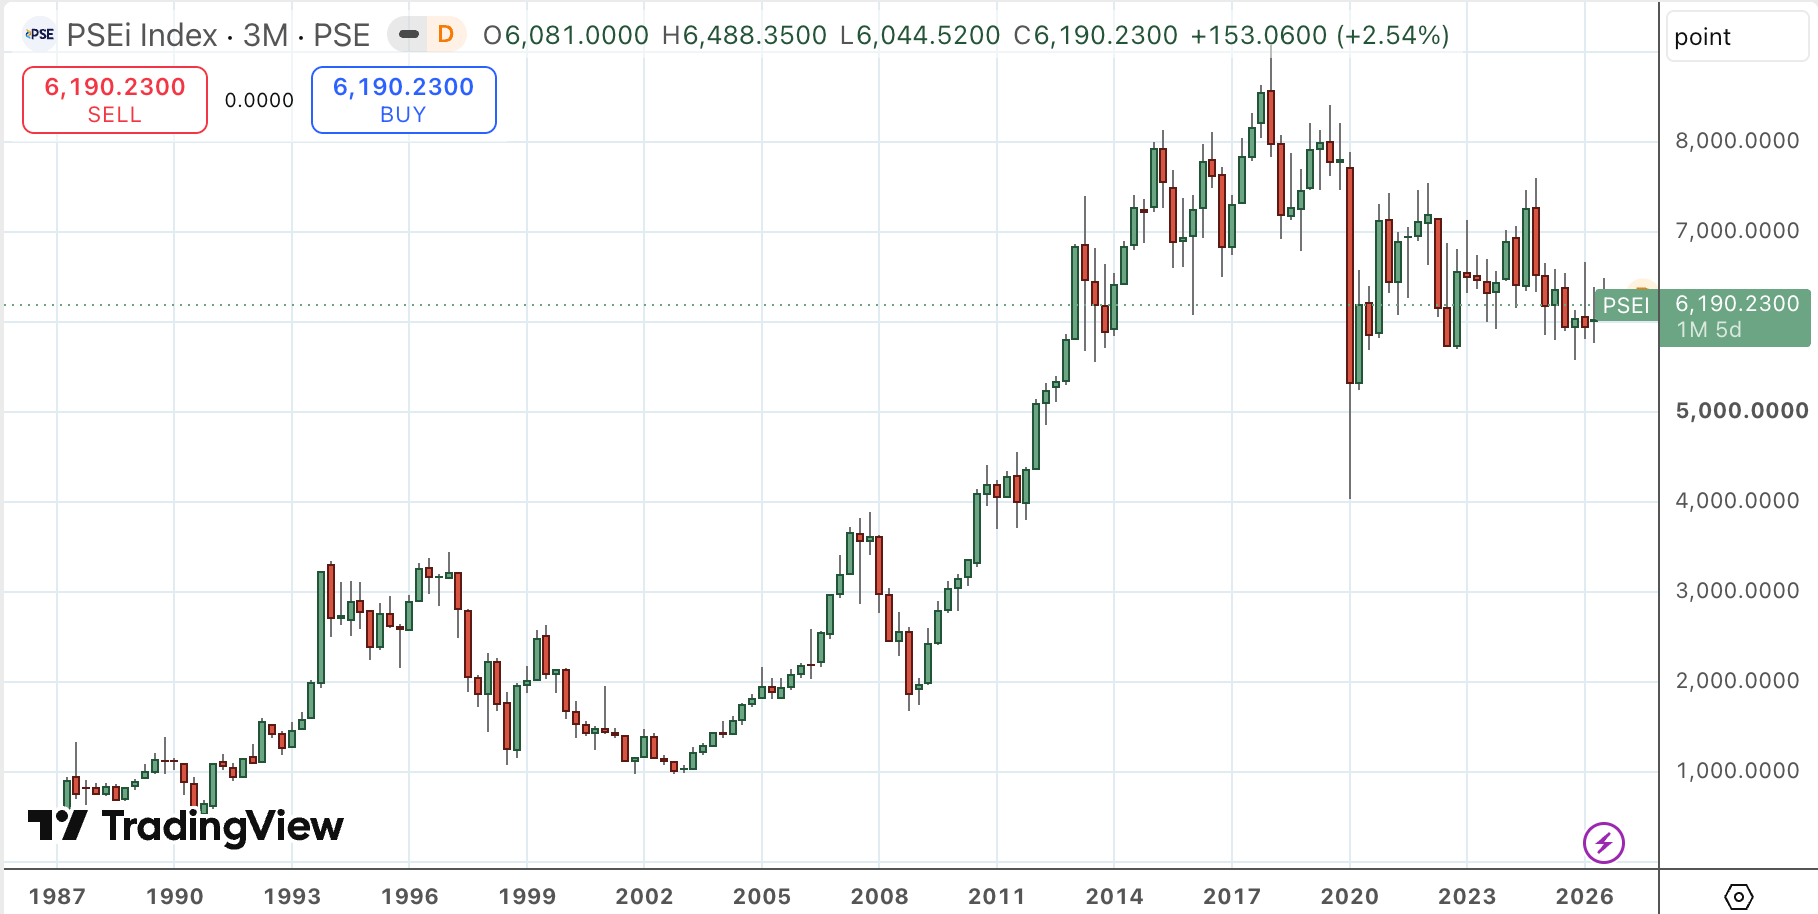
So why does the Philippines remind me of a Phase 0 market? Because stocks in the country seem to be suffering from post-bear-market neglect. Interest rates are high, causing a slump in the local property market and rising unemployment. At last year's PH Invest conference, hardly any foreigners were present. The market P/E has fallen to around 9x – a record low. Stock trading volumes are down by about half in notional terms since the 2013 peak, despite much higher GDP. The 2025 corruption scandal tainted Marcos Junior's reputation. Last year, there were only two IPOs during the entire year. There's still no catalyst for greater interest, especially as interest rates are rising again.
Thailand - Phase 1
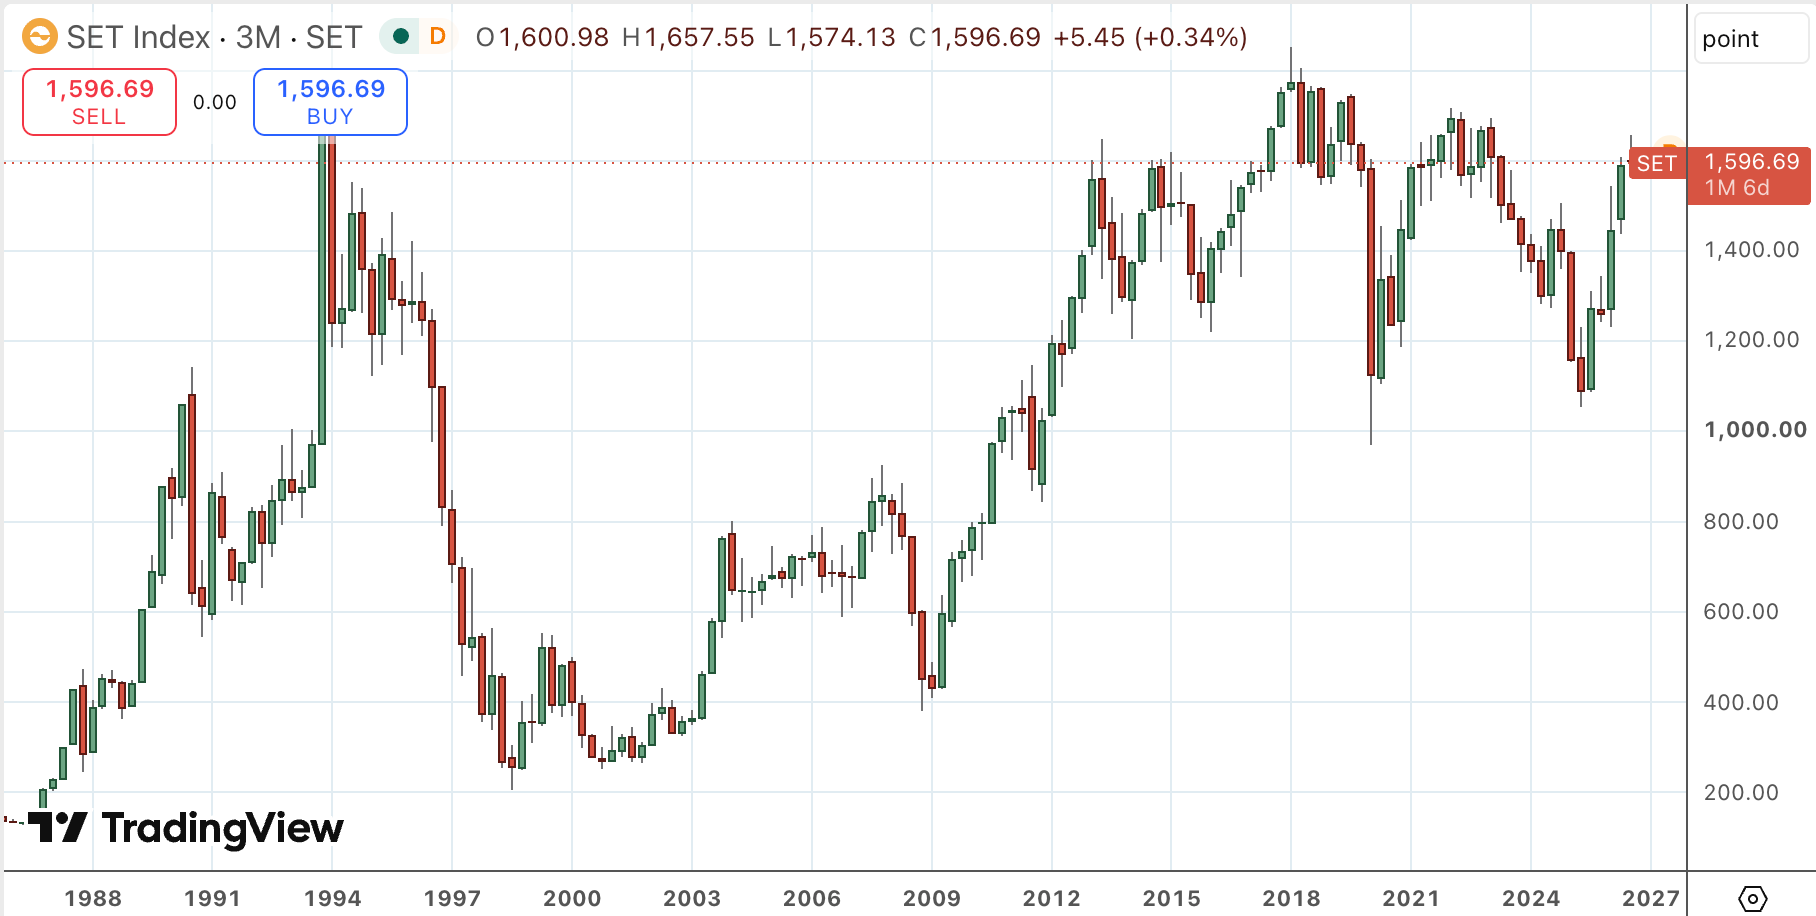
Thailand has had a two-year downturn, ostensibly due to weak credit creation. Trading volumes are down about 50% from the 2021 peak. The number of IPOs bottomed in 2023 and has picked up again. Tourism came back after COVID-19 but hasn't fully recovered. The property market is weak as well.
The Thai stock market is now showing signs of life. Corporate profits haven't recovered, and neither has credit creation. So it's still early days. One reason for optimism might be the Bhumjaithai Party's election win in early 2026, which raises the likelihood of a new stimulus package. That might have been the reason for the rally through most of 2026.
Hong Kong - Phase 1
After being deemed "uninvestible" back in 2022, Hong Kong property prices have staged a strong comeback. The government's Talent Pass visa has been a success, causing Mainland Chinese to move to the city. There's clearly more buzz than a few years ago, with greater optimism. In 2025, Hong Kong reached the top of the global IPO ranking. Flows from Mainland China through the Southbound Connect have been surprisingly high. Yet Hong Kong P/E ratios are still low. Office vacancy rates remain elevated and have only recently begun to improve, despite strong demand for Mainland Chinese companies.
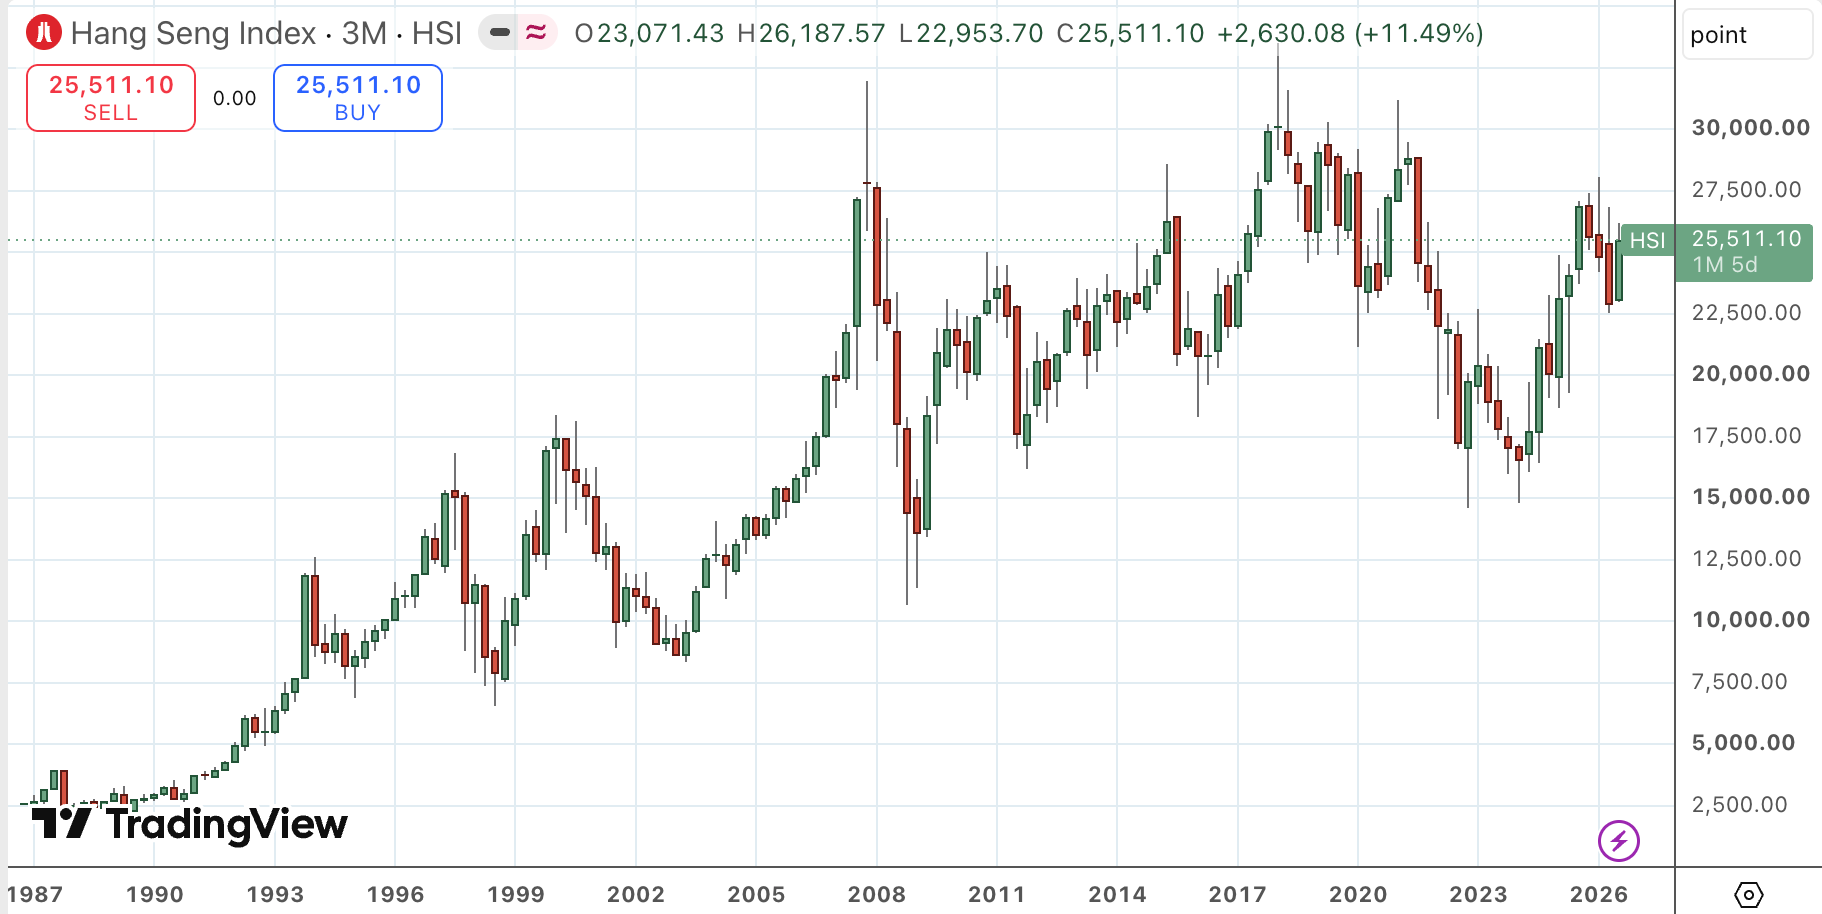
Malaysia - Phase 1
The Malaysian benchmark index has performed okay over the past two years, yet it trades at 14.7x P/E. The economy is increasingly benefiting from manufacturing moving out of Mainland China, with related heavy foreign direct investment. The Malaysian Ringgit is still cheap on a real effective exchange rate basis.
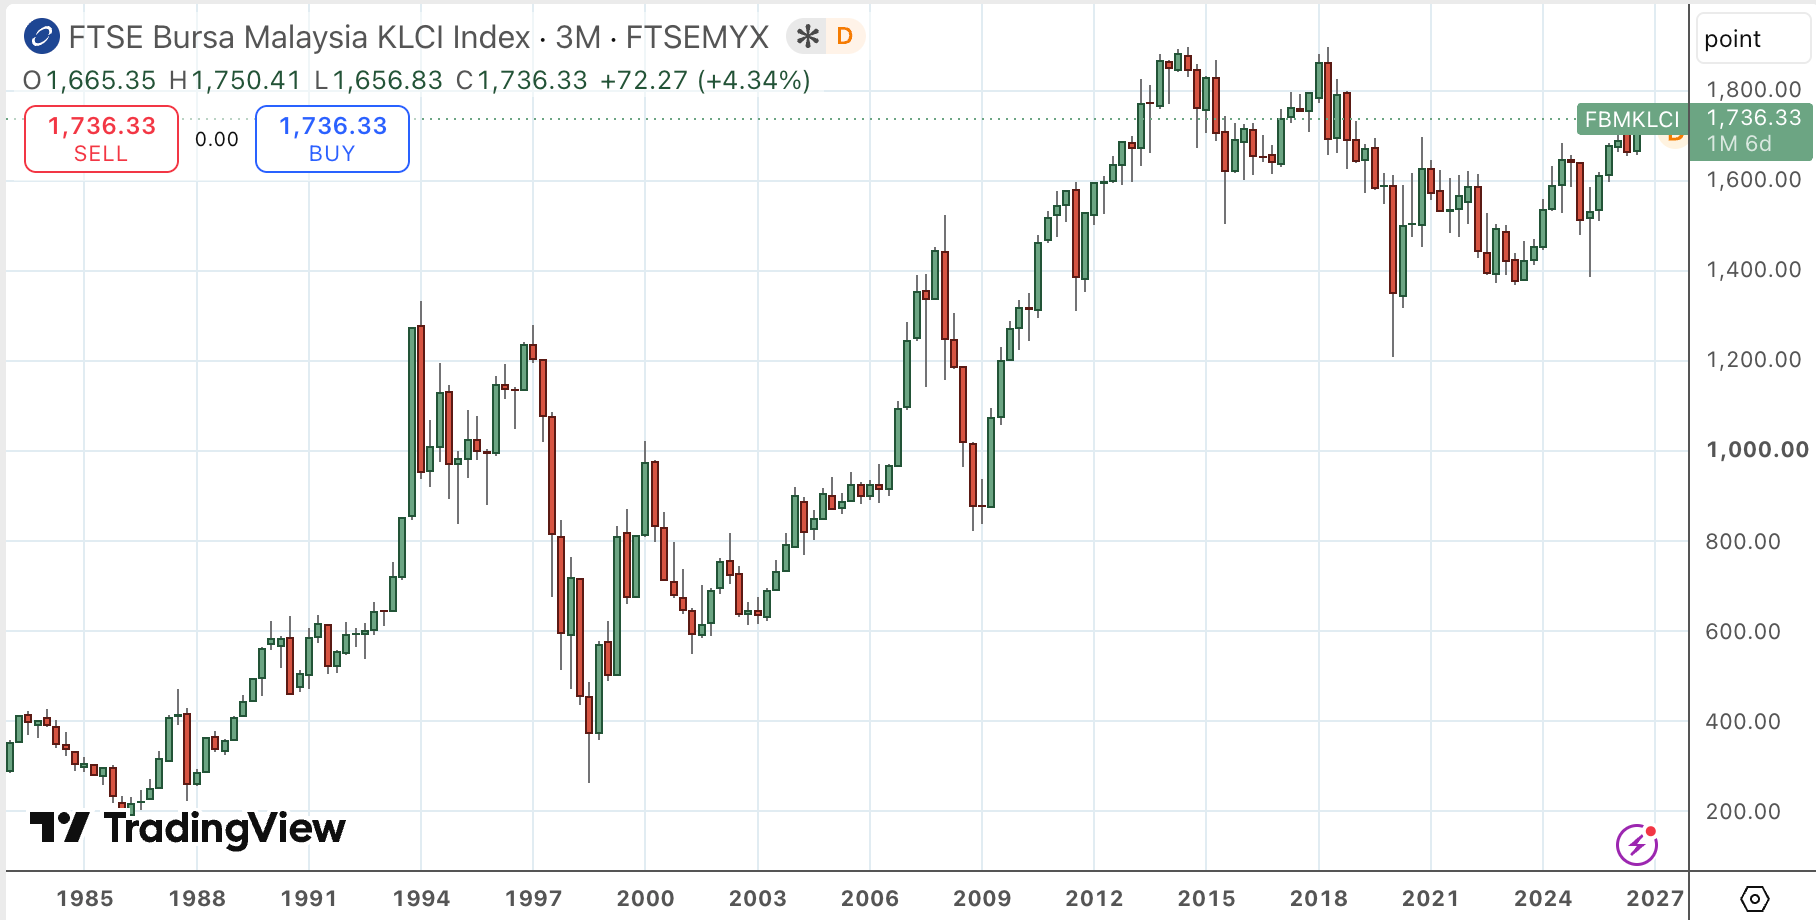
Singapore - Phase 2
The Singapore market has performed well since the Equity Market Development Program began in 2025 and expanded in 2026. The banks have been particularly strong performers. Inflows have continued to date with no signs of stopping. Tech companies moving down to Singapore from Mainland China have breathed life into the country, with the country being seen as a center for innovation. The currency has become expensive from an international perspective. The P/E ratio of 17x is average across the Asia-Pacific, but higher than Singapore's historical level.
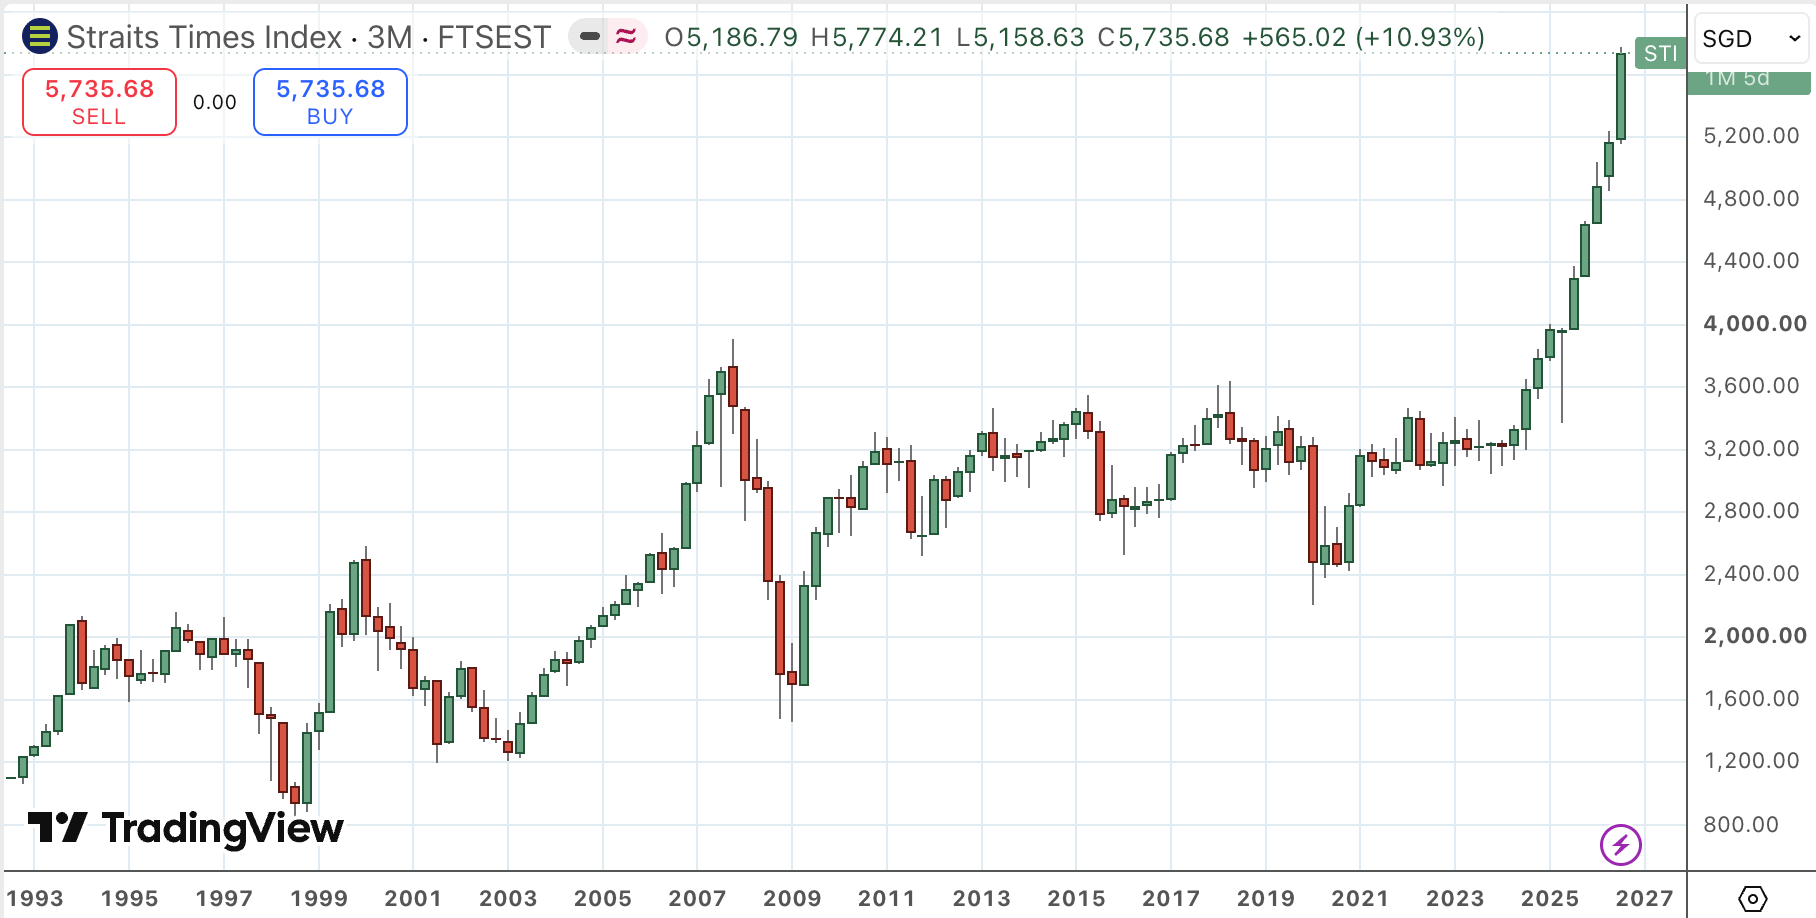
Vietnam - Phase 2
Vietnam is currently in a clear growth phase, helped by booming exports. It's a clear beneficiary of the diversification away from Chinese manufacturing and low US import tariffs. Future catalysts include FTSE Russell upgrading Vietnam from a frontier to an emerging market in September 2026. The index has risen rapidly, driven by key constituent Vingroup. The property market is scorching hot, with rental yields as low as 2% in Ho Chi Minh City. MSCI Vietnam now trades at almost 20x P/E.
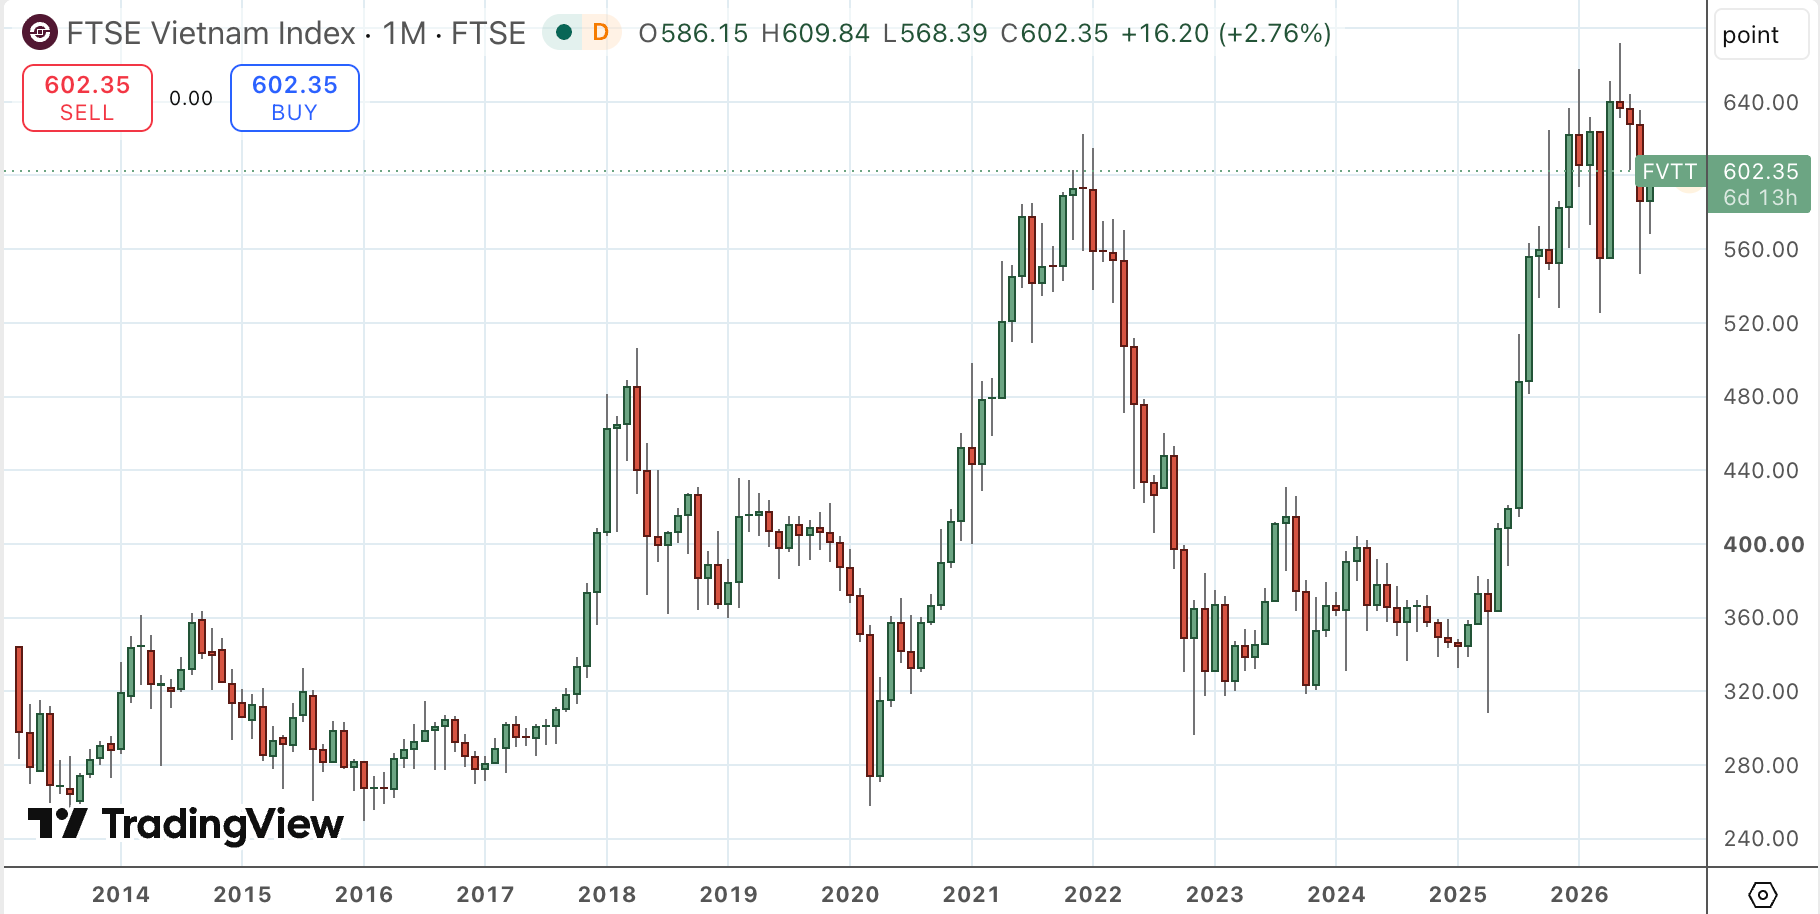
Japan - Phase 3
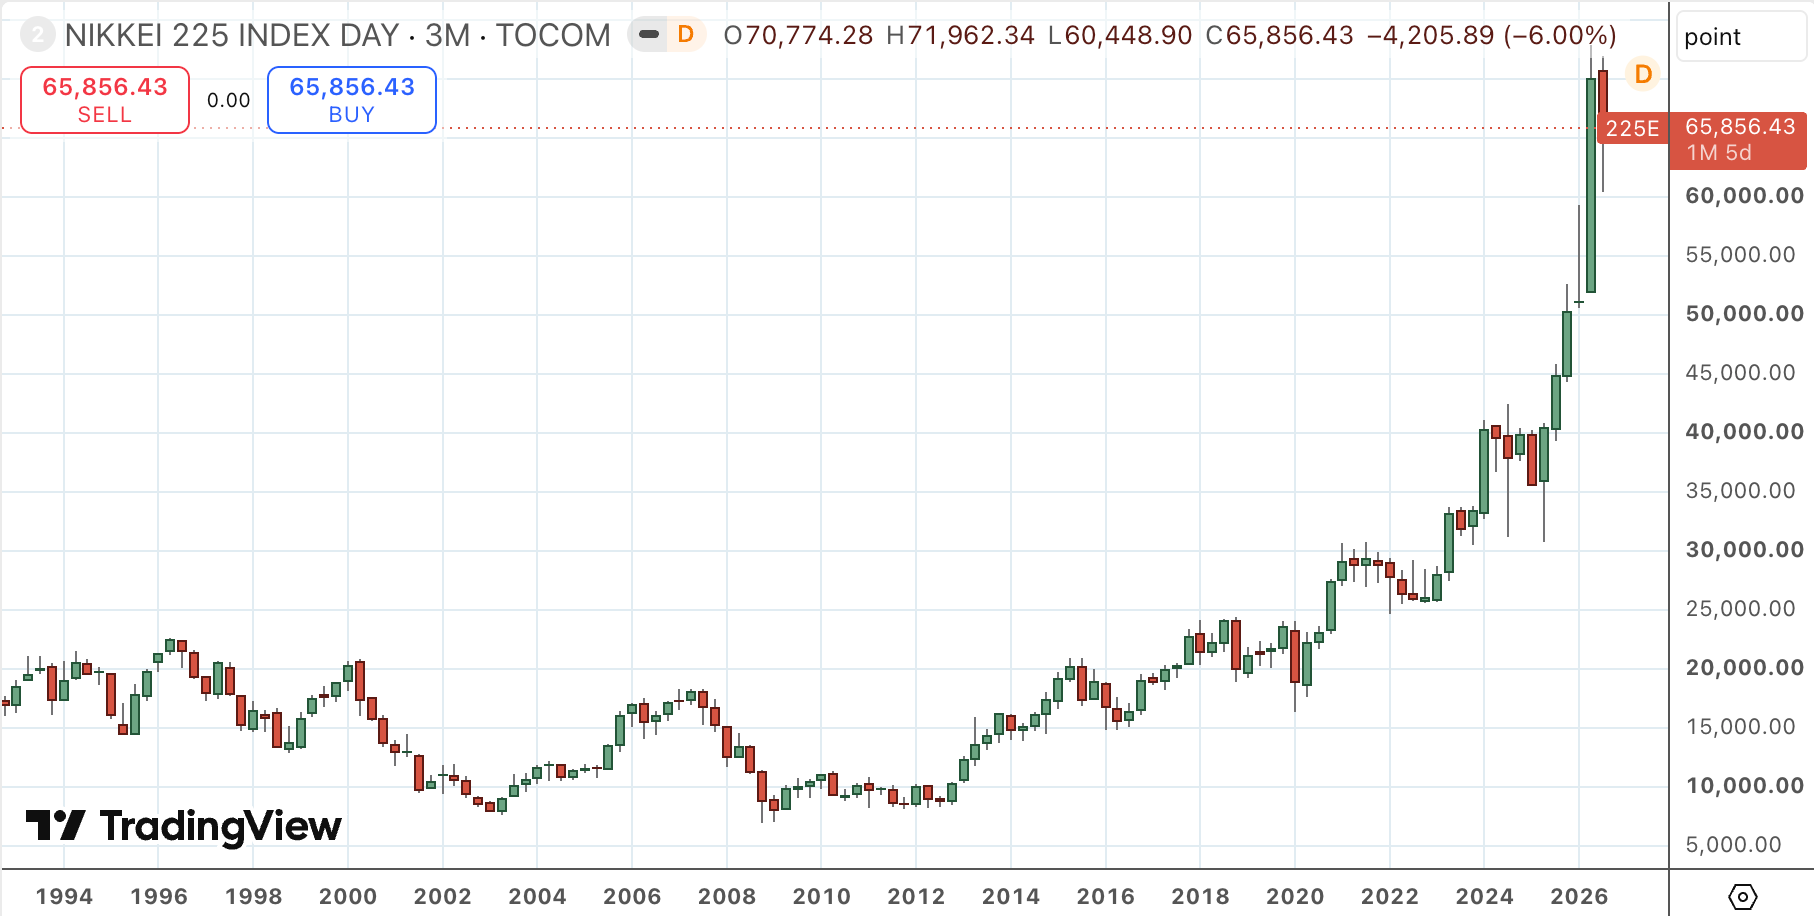
The Nikkei 225 has reached an all-time high, with obvious enthusiasm among global investors. Tokyo Stock Exchange reforms have also driven pro-market trends, including the dissolution of cross-shareholdings, record share buybacks, and higher dividends. Valuation multiples are now back to where they were before the Great Financial Crisis, around 2006. Trading volumes have hit an all-time high thanks to foreign inflows, NISA accounts and share buybacks.
However, negative signs are now emerging: the Bank of Japan is raising interest rates to the highest level since 1995. The weak yen has boosted earnings growth since 2022, though the growth seems to be decelerating. A potential shock to earnings would be a stronger Japanese yen, though the exchange rate remains at 159 to the US Dollar.
Australia - Phase 3
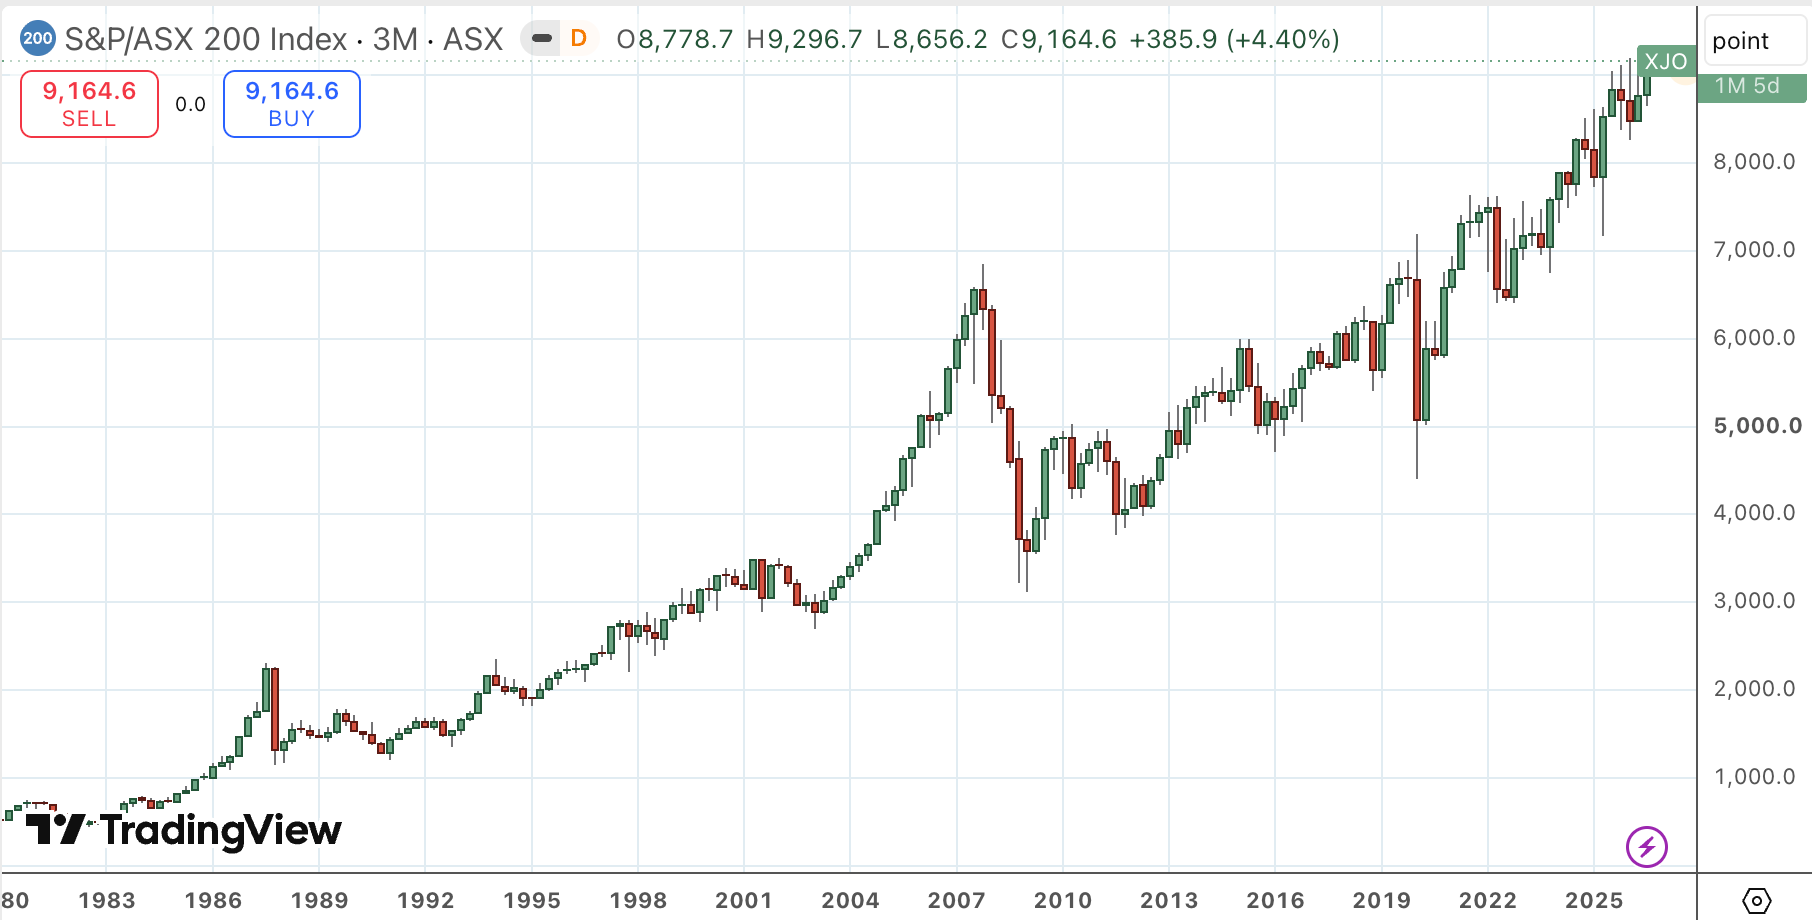
The ASX 200 hit a record high in August 2026, and valuation multiples are now stretched at 19x P/E. The major banks trade at close to 30x P/E. However, interest rate hikes are finally starting to hurt, and property prices in the major Australian cities have started to decline. The unemployment rate is still low, but the property market is a question mark. The economy has been straining under weaker demand for industrial commodities since China's construction boom fizzled out. It's as if the market is in a twilight zone where investors haven't recognized this new reality.
Taiwan - Phase 3
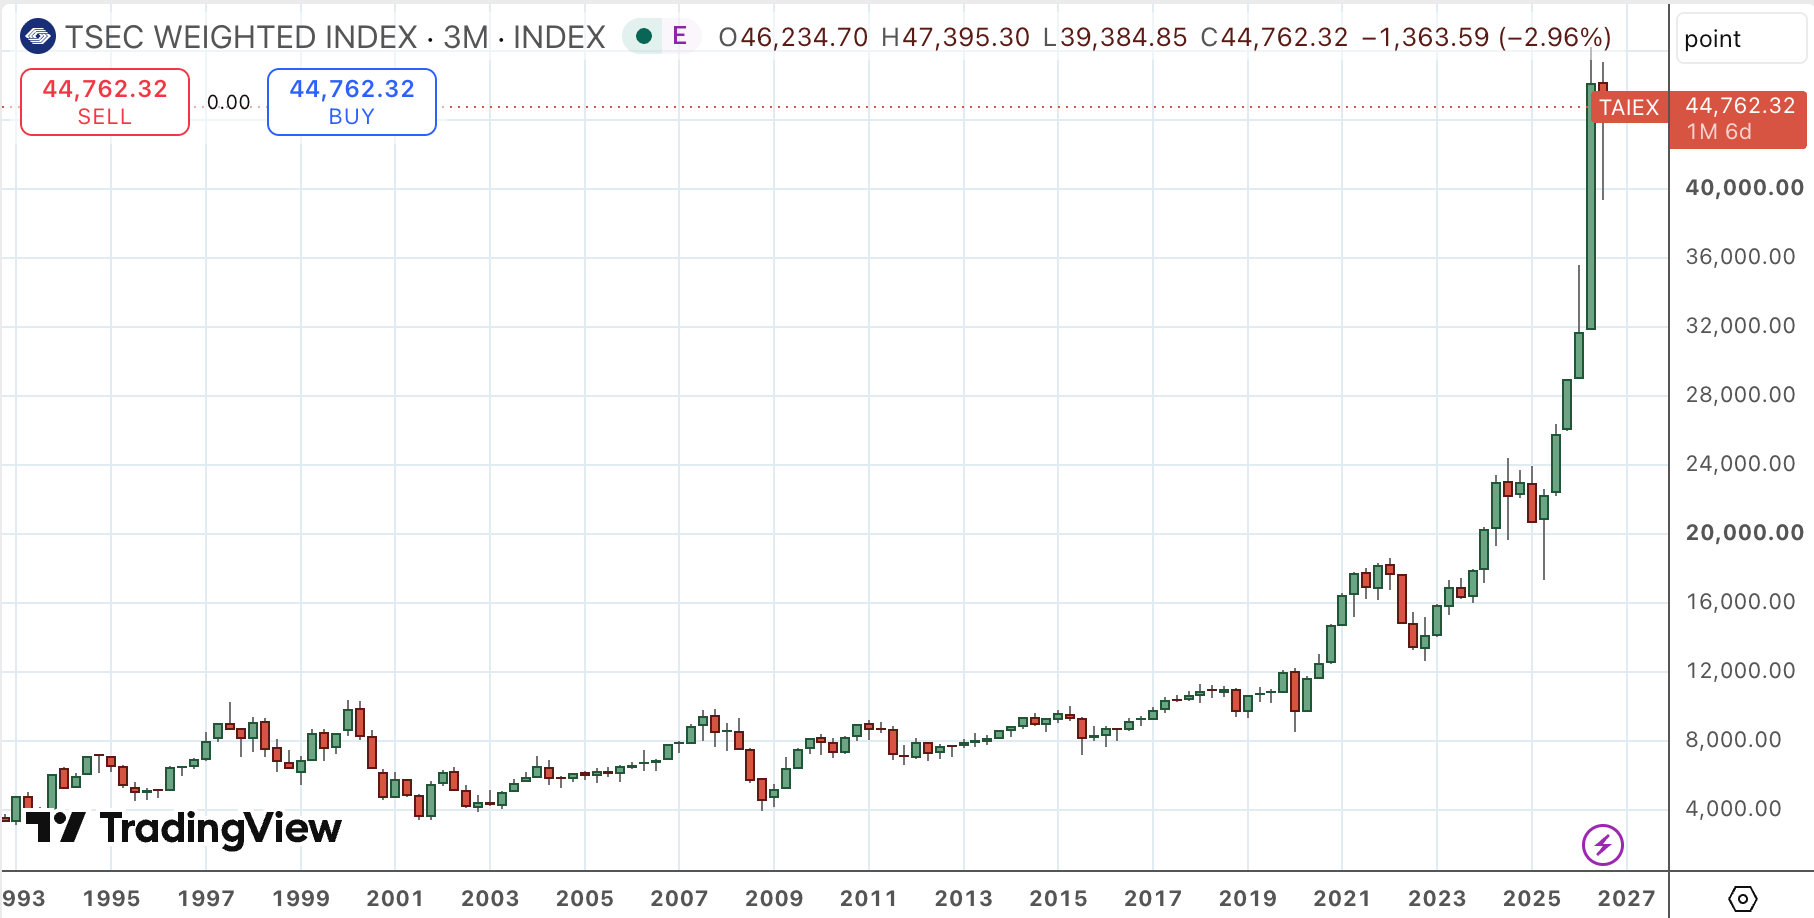
The TAIEX hit a record high in July 2026, driven by AI capex beneficiaries like TSMC. Clear signs of speculative frenzy emerged. GDP growth has been ridiculously high at 13% in the second quarter of 2026. Unemployment has hit a multi-year low. In the summer of 2026, the market wobbled as investors questioned whether record AI capex could continue forever. That said, TSMC accounts for close to half the index, so the market's direction largely depends on one company's earnings profile. Breadth has weakened over the past few quarters, suggesting the market is running out of steam.
South Korea - Phase 3
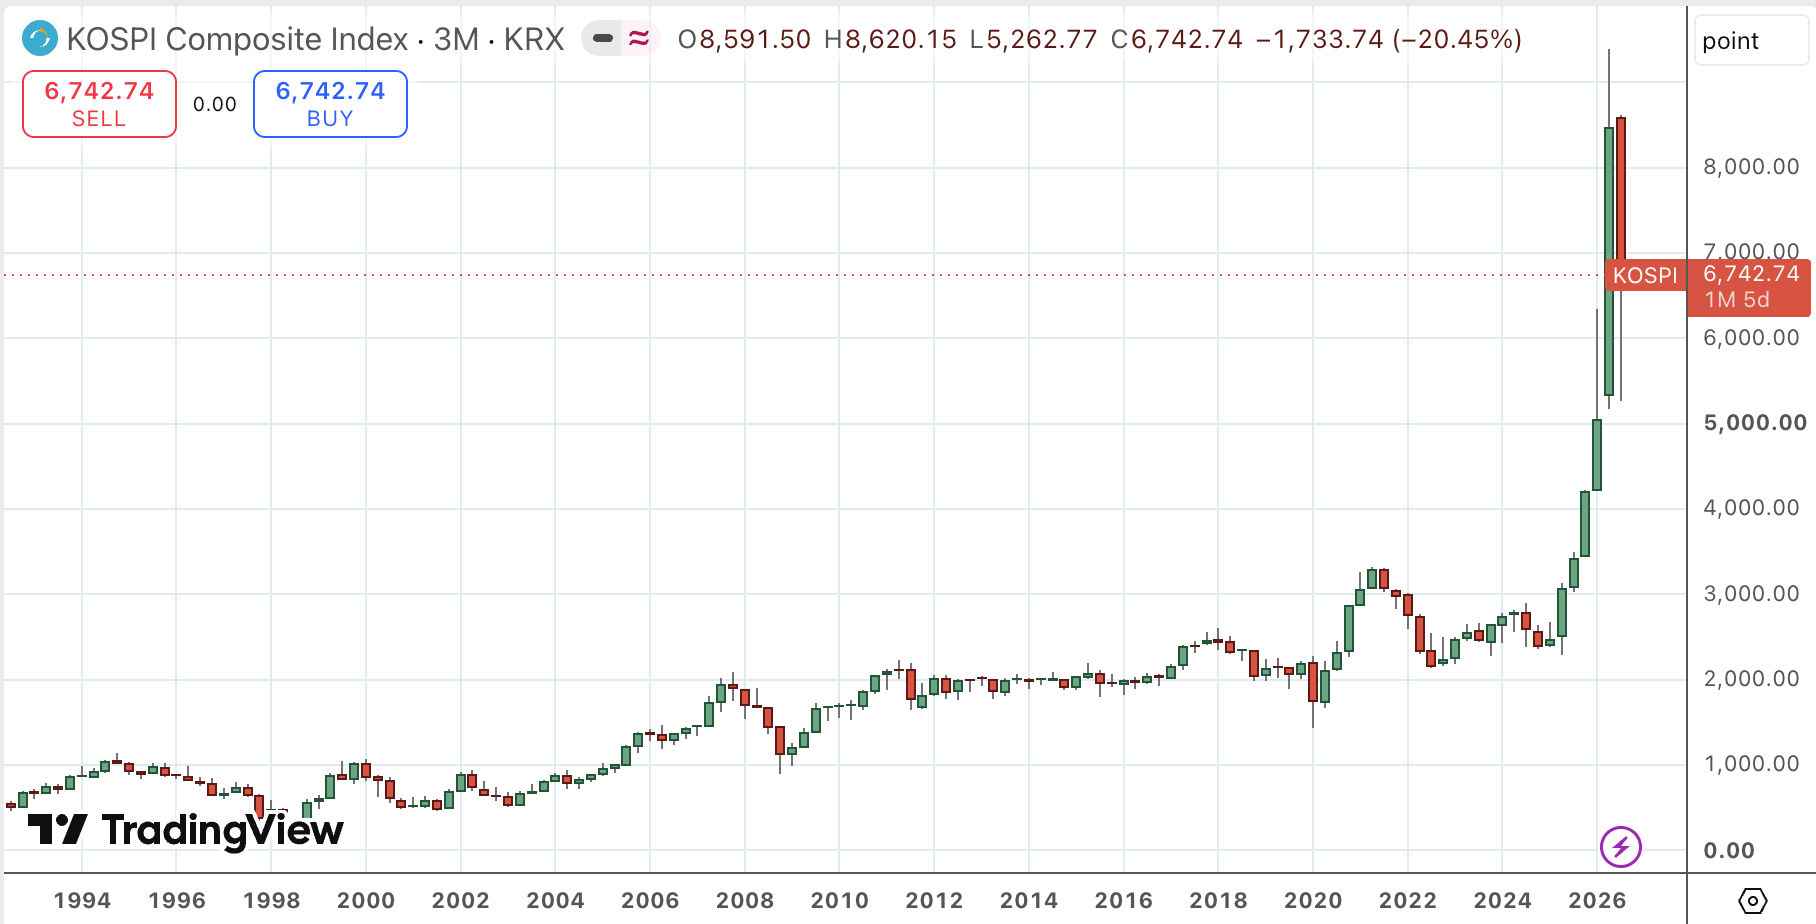
The KOSPI is up over 100% year-on-year due to an epic bull market in memory chip prices, despite a recent crash. The KOSPI now trades at over 3x book, far higher than its historical averages. Retail participation is high, and margin debt hit a record level. Regulators have now clamped down, introducing restrictions on single-stock leveraged ETFs.
Beyond KOSPI, stocks are still relatively inexpensive, and the governance reforms are real, suggesting that small-cap Korea sings to a different tune. So while there are clear signs of excess, Korea doesn't map onto Faber's framework perfectly.
India - Phase 4
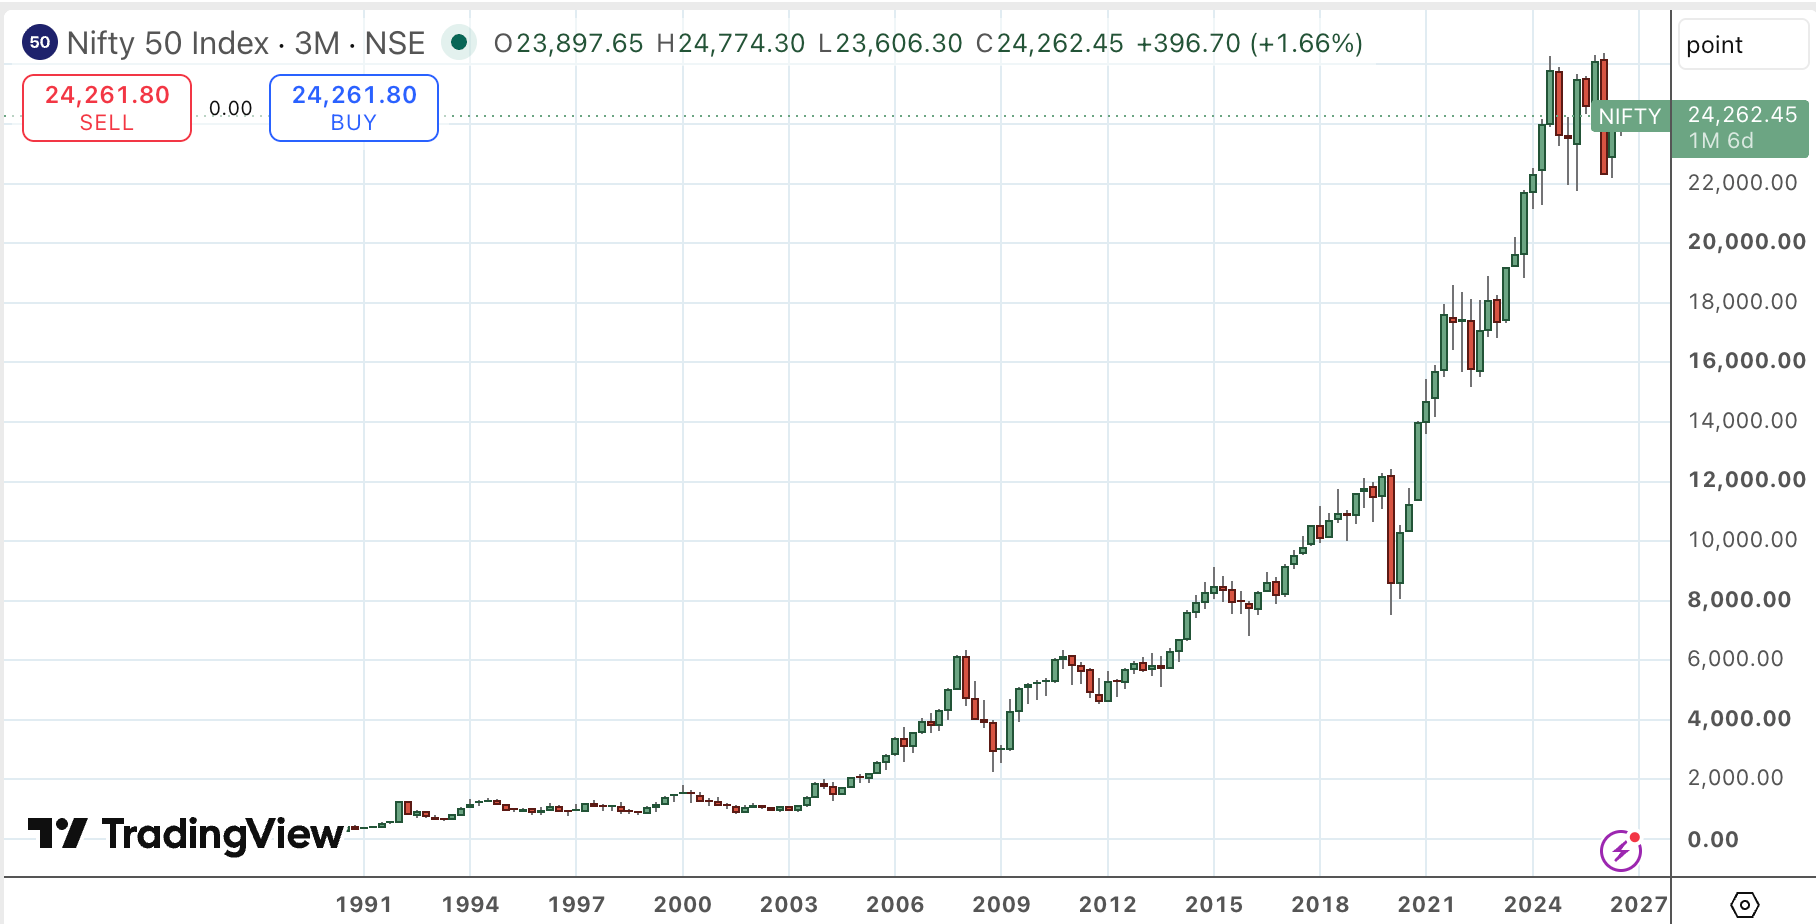
India's reported growth numbers are still strong at 6.5%, but the stock market has come off a bit. The IPO market peaked in 2024. Investors are still bullish. The booming stock market has created enormous wealth, and investors like Pulak Prasad are revered. Valuation multiples remain high, despite having fallen since peak euphoria in 2024.
New Zealand - Phase 5
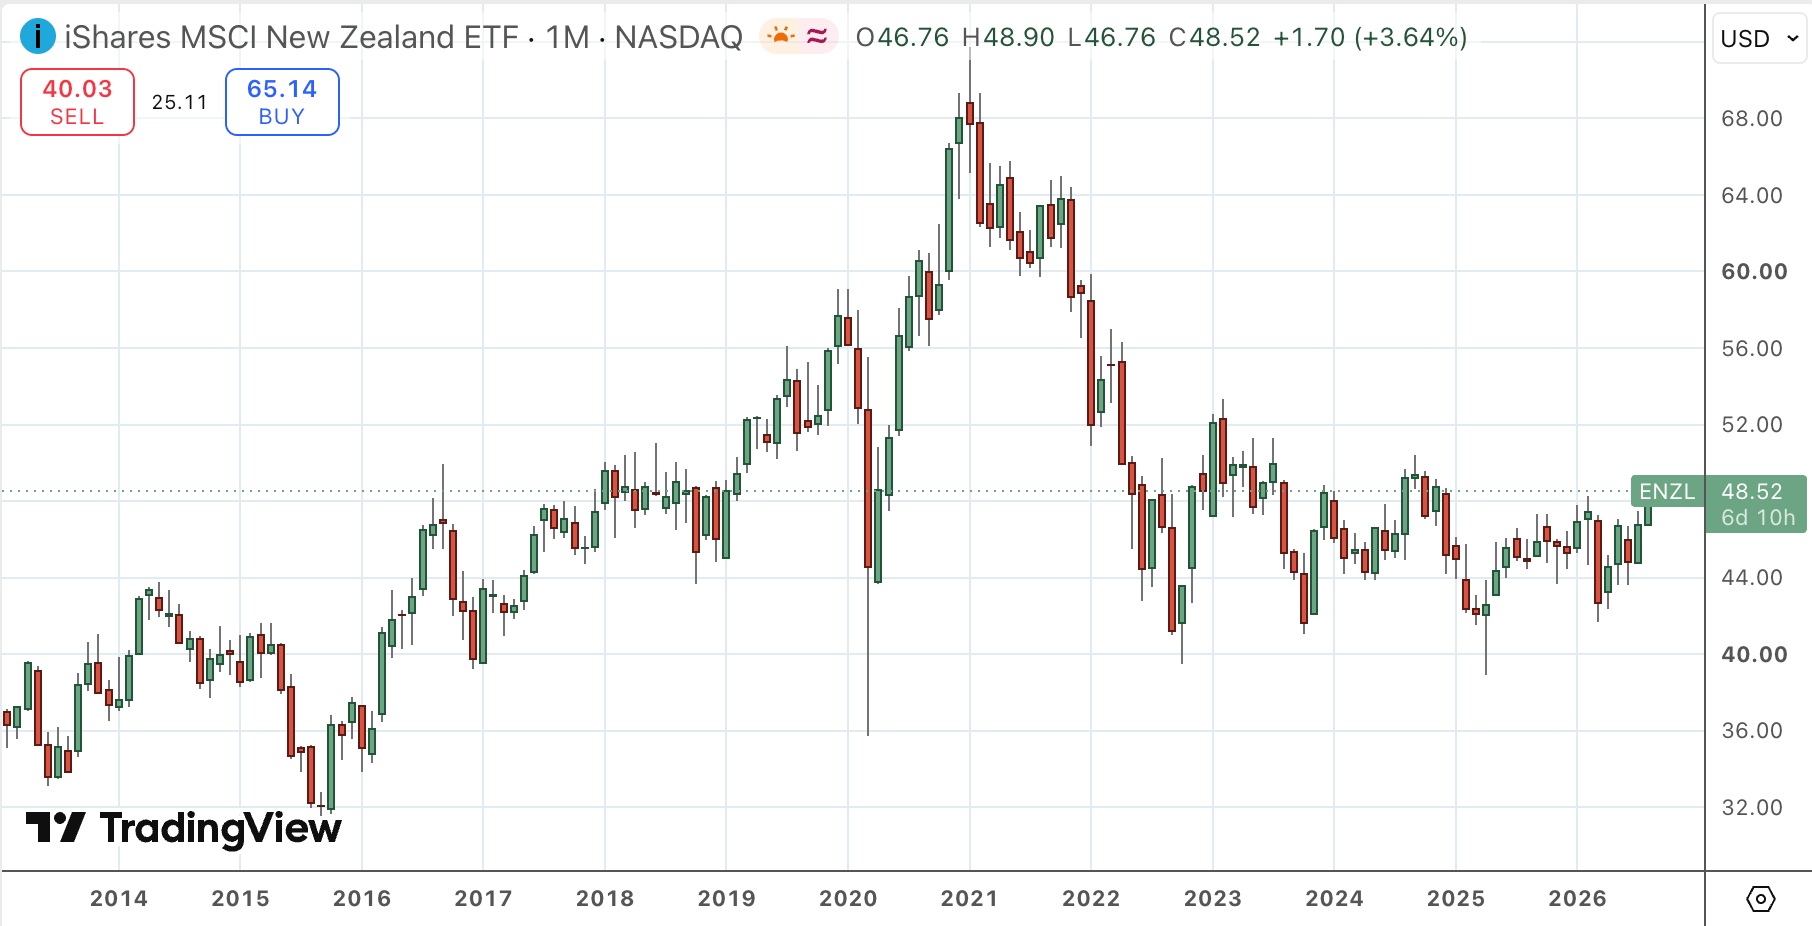
New Zealand's property market entered a downturn in 2021, and MSCI New Zealand followed it closely. The unemployment rate is at a decade high. It's currently flirting with a recession. Valuation multiples are still high at almost 30x; however, partly due to the index composition and pension fund flows.
China - Phase 5
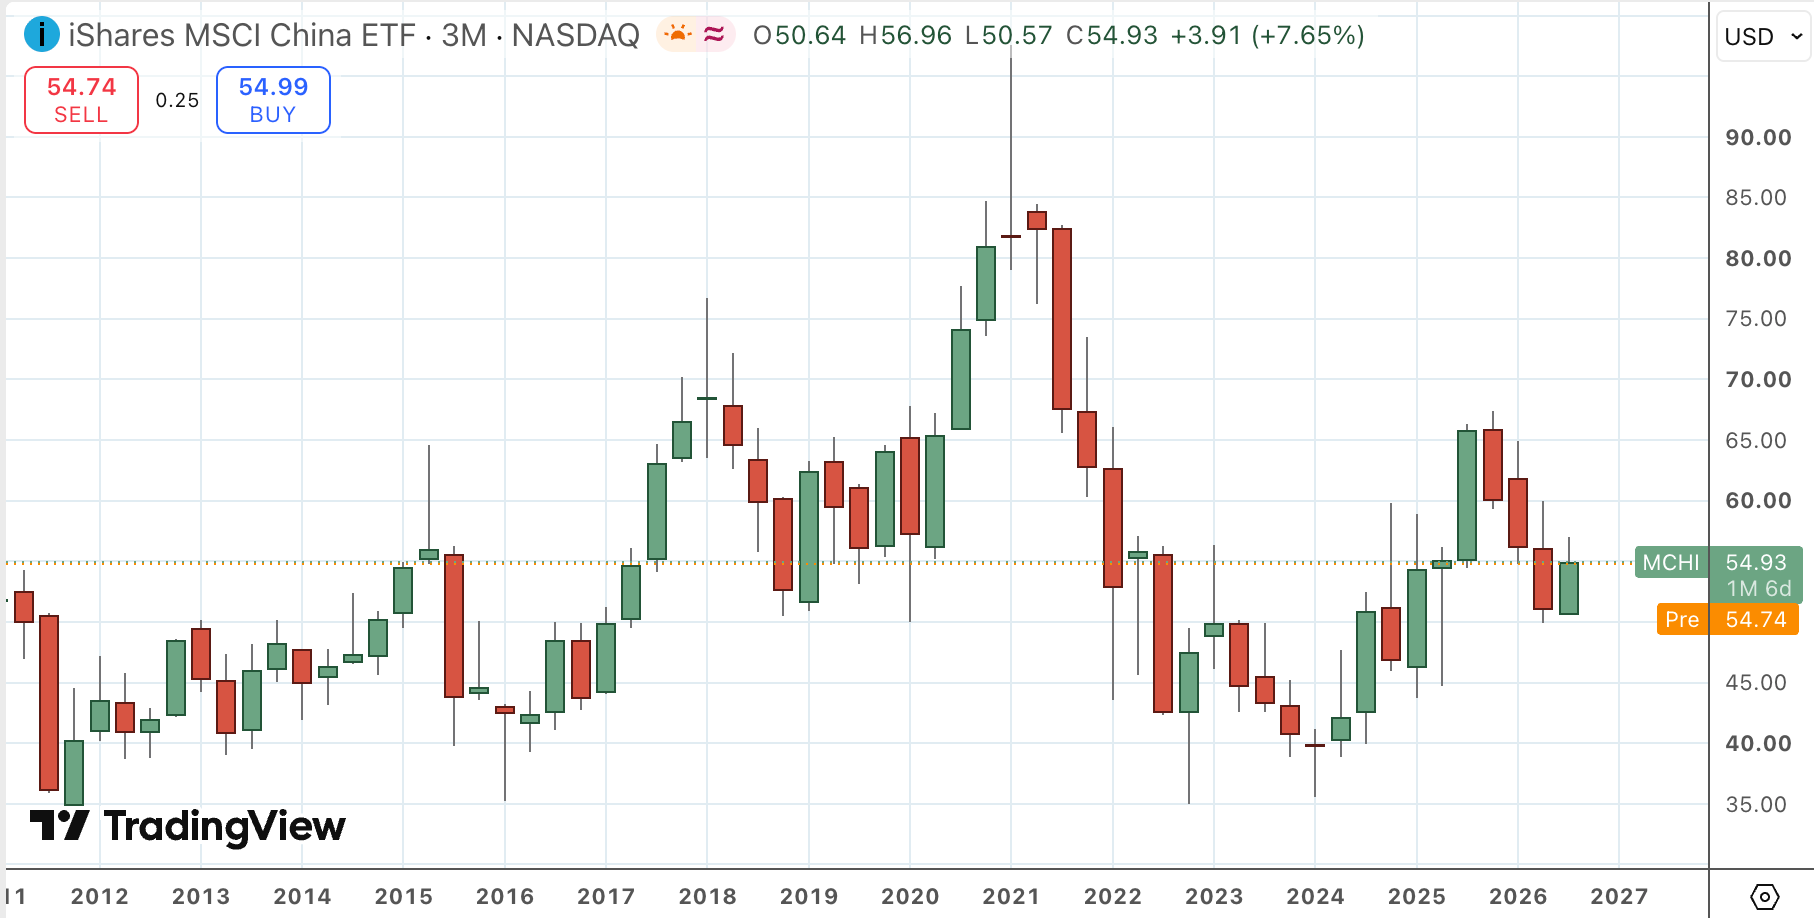
China is in a clear downturn, with property prices now falling steadily since the peak in 2021. Residential new starts are down 70%, mirroring the aftermath of Japan's property boom in the 1990s. China's credit growth continues to decelerate. The 10-year bond is now a mere 1.7%, suggesting weak nominal growth and deflationary pressures. P/E multiples are low but not the lowest in the region. Gleaming skyscrapers on social media and strength in sectors such as electric vehicles and AI make some investors optimistic, but the overall economic picture remains weak. Insiders in the A-share market have been selling for most of the past two years.
Indonesia - Phase 6
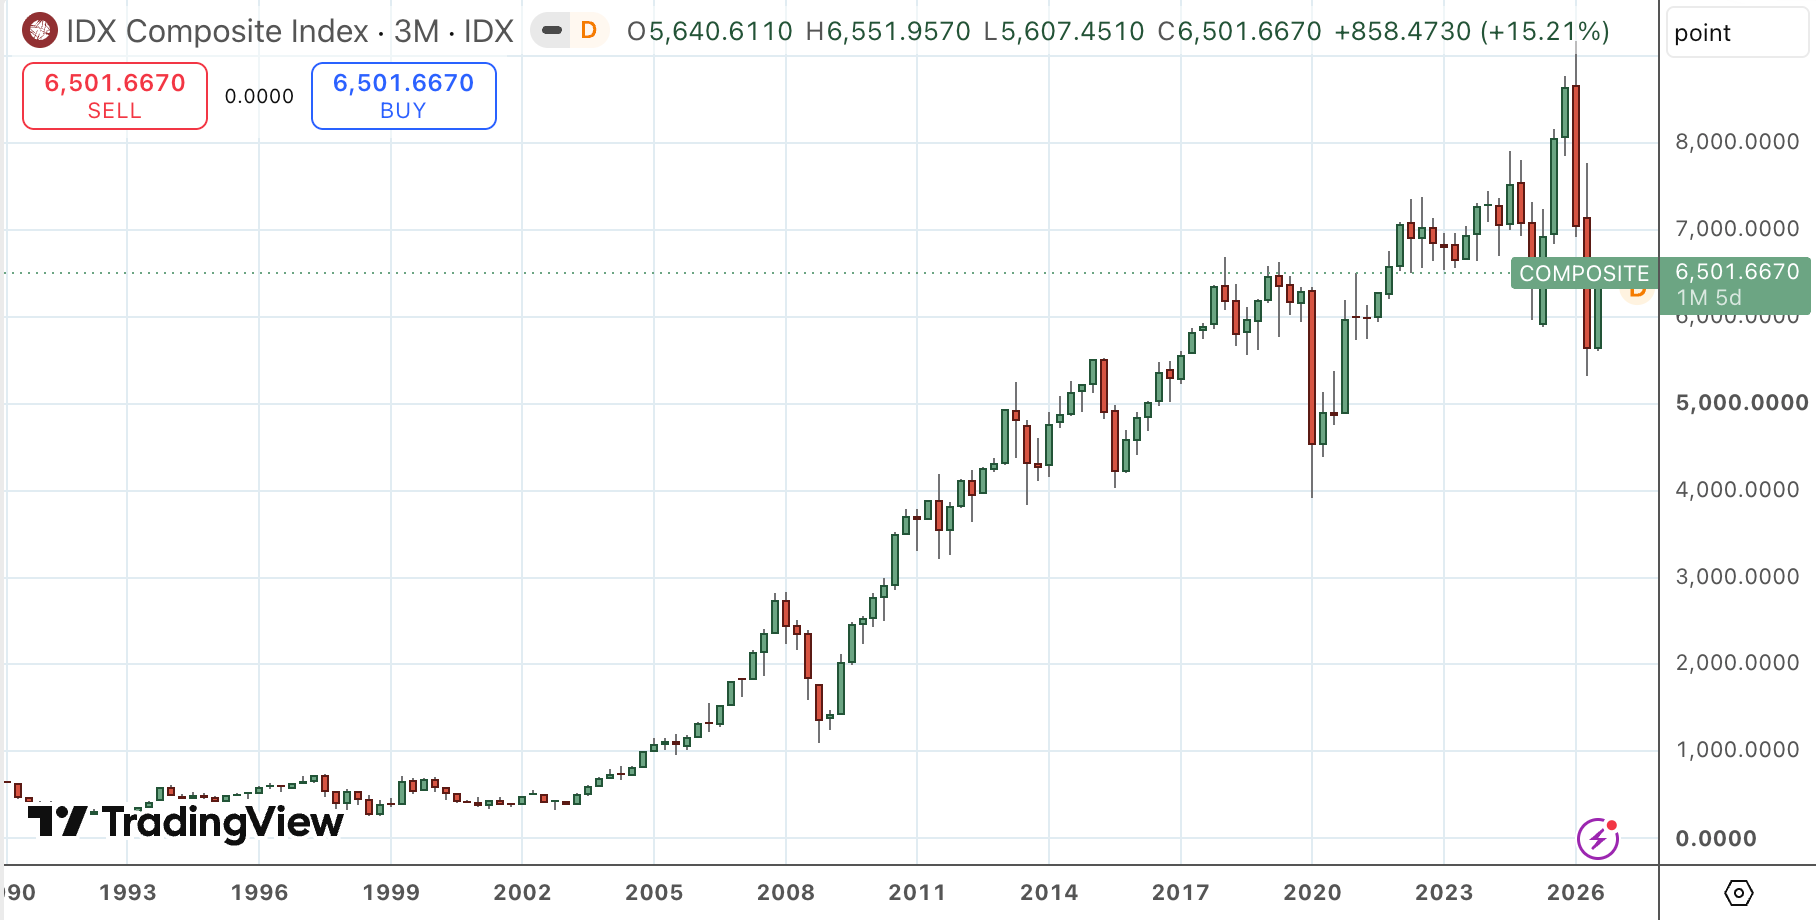
There are clear signs of capitulation in Indonesia. Under President Prabowo Subianto, markets have been unsettled by proposals for plantation land expropriation, reported corruption investigations into the school lunch program and the launch of a new sovereign wealth fund. As far as I can tell, investor confidence is now low. MSCI has announced that it's considering downgrading Indonesia from an Emerging to a Frontier market. Many investors have simply reduced their exposure to zero. FX reserves kept declining through most of 2026 until July, suggesting capital flight to nearby countries like Singapore.
Conclusion
This exercise should not be taken too seriously. The life cycle template will never fit a single market perfectly.
- For example, South Korea's KOSPI and Taiwan's TAIEX have both rallied on the back of the AI bull market. But small caps outside the tech industry in either country still trade at low multiples.
- Conversely, the IDX Composite Index has barely fallen from its peak, but Indonesian consumer stocks have suffered a decade-long bear market.
Still, tracking cyclical indicators like IPO activity, unemployment rates, real estate prices, fund flows, etc can probably give us a broad picture of the cycle.
So what does the life cycle template tell about Asian markets in 2026? As far as I can tell, much of Southeast Asia looks like it's in an early stage of its emerging-market life cycle. And tech-heavy markets in East Asia remind me of past historical peaks. Though who know what the future actually holds.