Shipbuilding 101 ⚓️
The shipyard industry is cyclical and competitive. But supply has shrunk significantly while demand is picking up. Estimated reading time: 24 minutes


Disclaimer: Asian Century Stocks uses information sources believed to be reliable, but their accuracy cannot be guaranteed. The information contained in this publication is not intended to constitute individual investment advice and is not designed to meet your personal financial situation. The opinions expressed in such publications are those of the publisher and are subject to change without notice. You are advised to discuss your investment options with your financial advisers. Consult your financial adviser to understand whether any investment is suitable for your specific needs. I may, from time to time, have positions in the securities covered in the articles on this website. This is not a recommendation to buy or sell stocks.
Summary
- Shipbuilding is a pretty dismal industry, with low margins and vulnerability to movements in labour costs, exchange rates and commodity prices.
- The supply of shipyard capacity has dropped since the last peak in 2008 and has only now started to peak.
- Meanwhile, demand for shipyard capacity has improved thanks to record orders for containerships and LNG carriers.
- Environmental regulation will also increase the demand for shipyard capacity, as existing vessels need to be replaced or upgraded to meet the 2050 green goals set out by the industry body IMO.
- While shipyards have been burdened by rising wages and prices for steel, those headwinds are now disappearing. New-build prices have also gone up, suggesting that yard profitability is about to improve.
- The Korean shipyards are well-placed to meet the demand for more environmentally-friendly and complex-to-build ships. But those stocks are trading at high multiples.
- Yangzijiang and Namura Shipbuilding in Japan trade at lower multiples. The former has almost unbelievable 20%-type operating margins. Namura Shipbuilding benefits from the weaker yen and is well-placed to benefit from an uptick in tanker orders.
- Meanwhile, Kawasaki Heavy Industries and Austal are well-placed to benefit from the secular trend of higher defence spending.

Table of contents
1. The basics of shipbuilding
2. How shipyards make money
3. Regulatory environment
4. Supply & demand for shipyard capacity
5. Shipbuilding industry map
5.1. South Korea
5.2. China
5.3. Japan
5.4. India
5.5. Other countries
6. Conclusion
1. The basics of shipbuilding
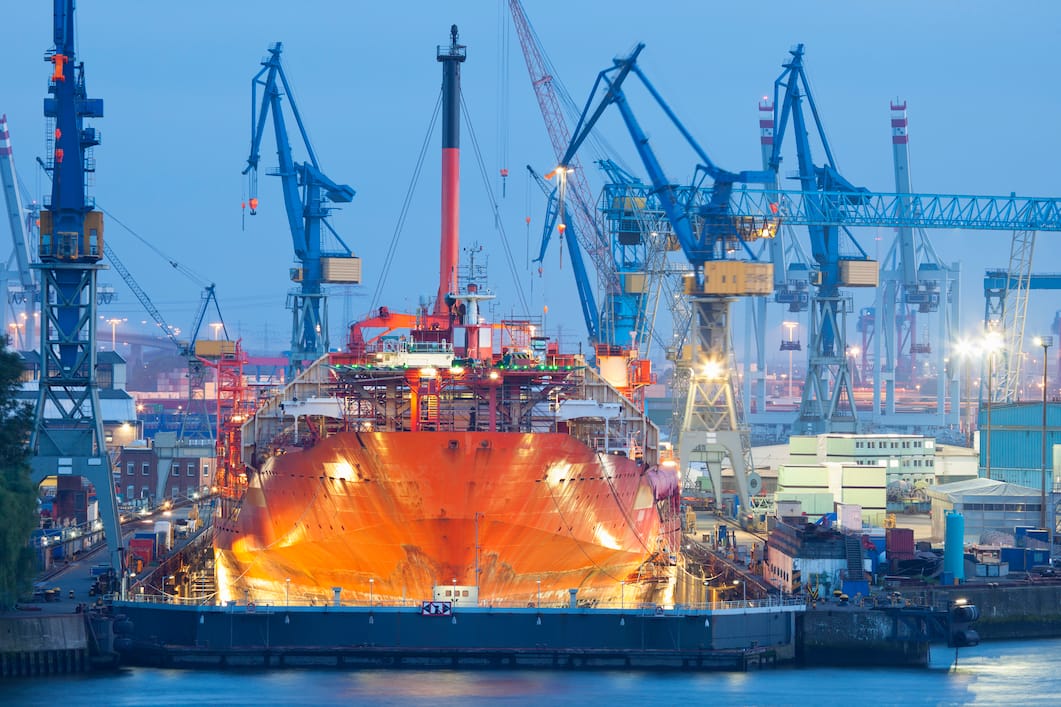
Shipbuilding is a simple business. Buy a piece of land next to the sea or the banks of a river. Then set up workshops, equipment and manpower to construct vessels.
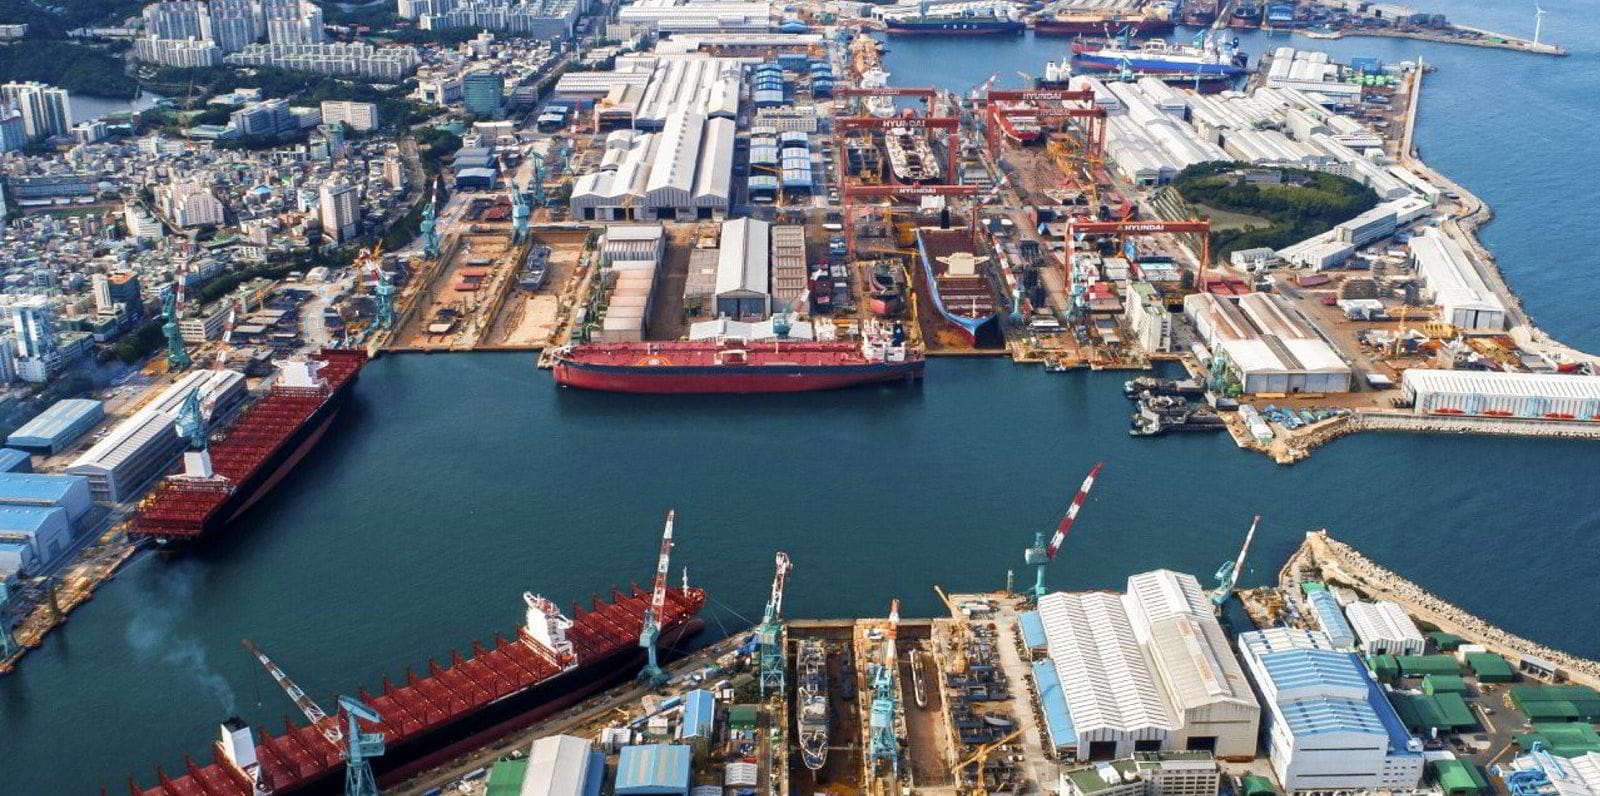
Here is an illustration of how a typical shipyard might look like, using Hyundai’s Mipo shipyard in Ulsan, South Korea, as an example:
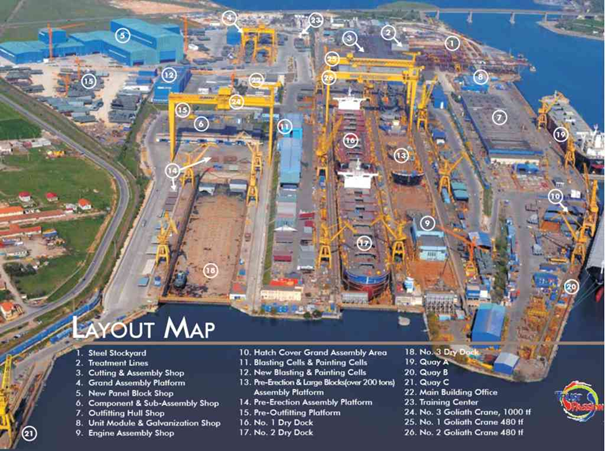
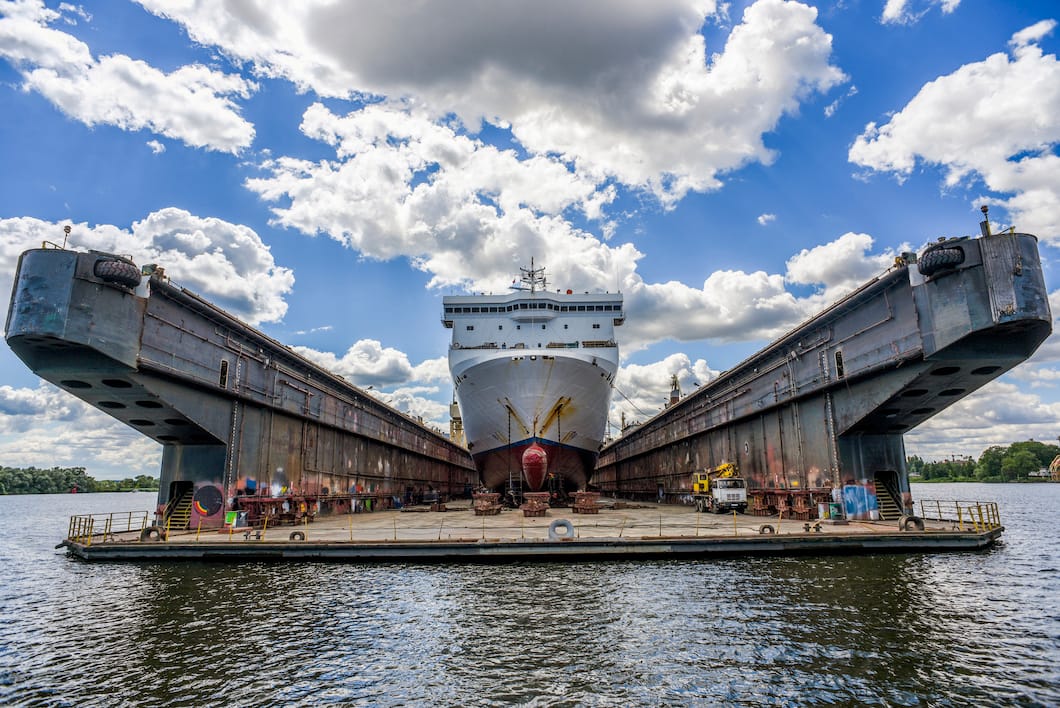
Production of parts takes place in workshops, and final assembly is then done in either dry docks (on land) or floating docks (in water). Large cranes move parts between each section.
Here are the key steps of the process of building a vessel, most of which are mentioned in the picture above:
- Cutting factory: A cutting factory is used to create steel parts, of which you typically need 50,000-100,000 for a single ship.
- Assembly line: Small and middle-sized blocks are connected into large blocks, each weighing more than 400 tonnes.
- Blasting and painting: These large blocks are blasted with iron powder to clean the surfaces and then painted.
- Outfitting factory: Pipes and electric cables are installed to blocks such as the engine room.
- Grand assembly site: This is the place where the grand assembly blocks are built by connecting large blocks from the assembly lines.
- Dry dock: This is where the hulls of the ship are constructed from the grand assembly blocks. Dry = on land.
- Float-out: Finally, the vessel is put into the sea by raising the water level in the dry dock - a so-called “float-out”. The ship is then delivered to its new owner.
The amount of work needed to build a ship is usually measured as compensated gross tonnage (“CGT”). You calculate the CGT by taking the cubic feet of the ship’s internal value and then adjusting that number with a coefficient based on the additional workload required to build a particular ship.
For example, the internal spaces of a passenger ship are far more complex than those of a dry bulk carrier, and their coefficients will therefore differ. Any unit of CGT will be roughly the same in terms of the workload needed to be done by the shipyard.
Deadweight tonnage (“DWT”) is a completely different metric. It instead measures what weight in tonnes a vessel can carry.
Here are the main types of ships that are typically built by shipyards:

Cruise ships, ferries, yachts and motor- or sailboats are included in the passenger boat- or passenger ship category. The general cargo category includes containerships and so-called break bulk ships such as roll-on-roll-off (for passenger vehicles), reefer vessels (refrigerated for transport of fruits, etc.), livestock vessels, etc. In the bulk cargo category, you’ll find dry bulk ships used for commodities such as coal, iron ore etc., and tankers used for the transport of crude oil, LNG, etc.
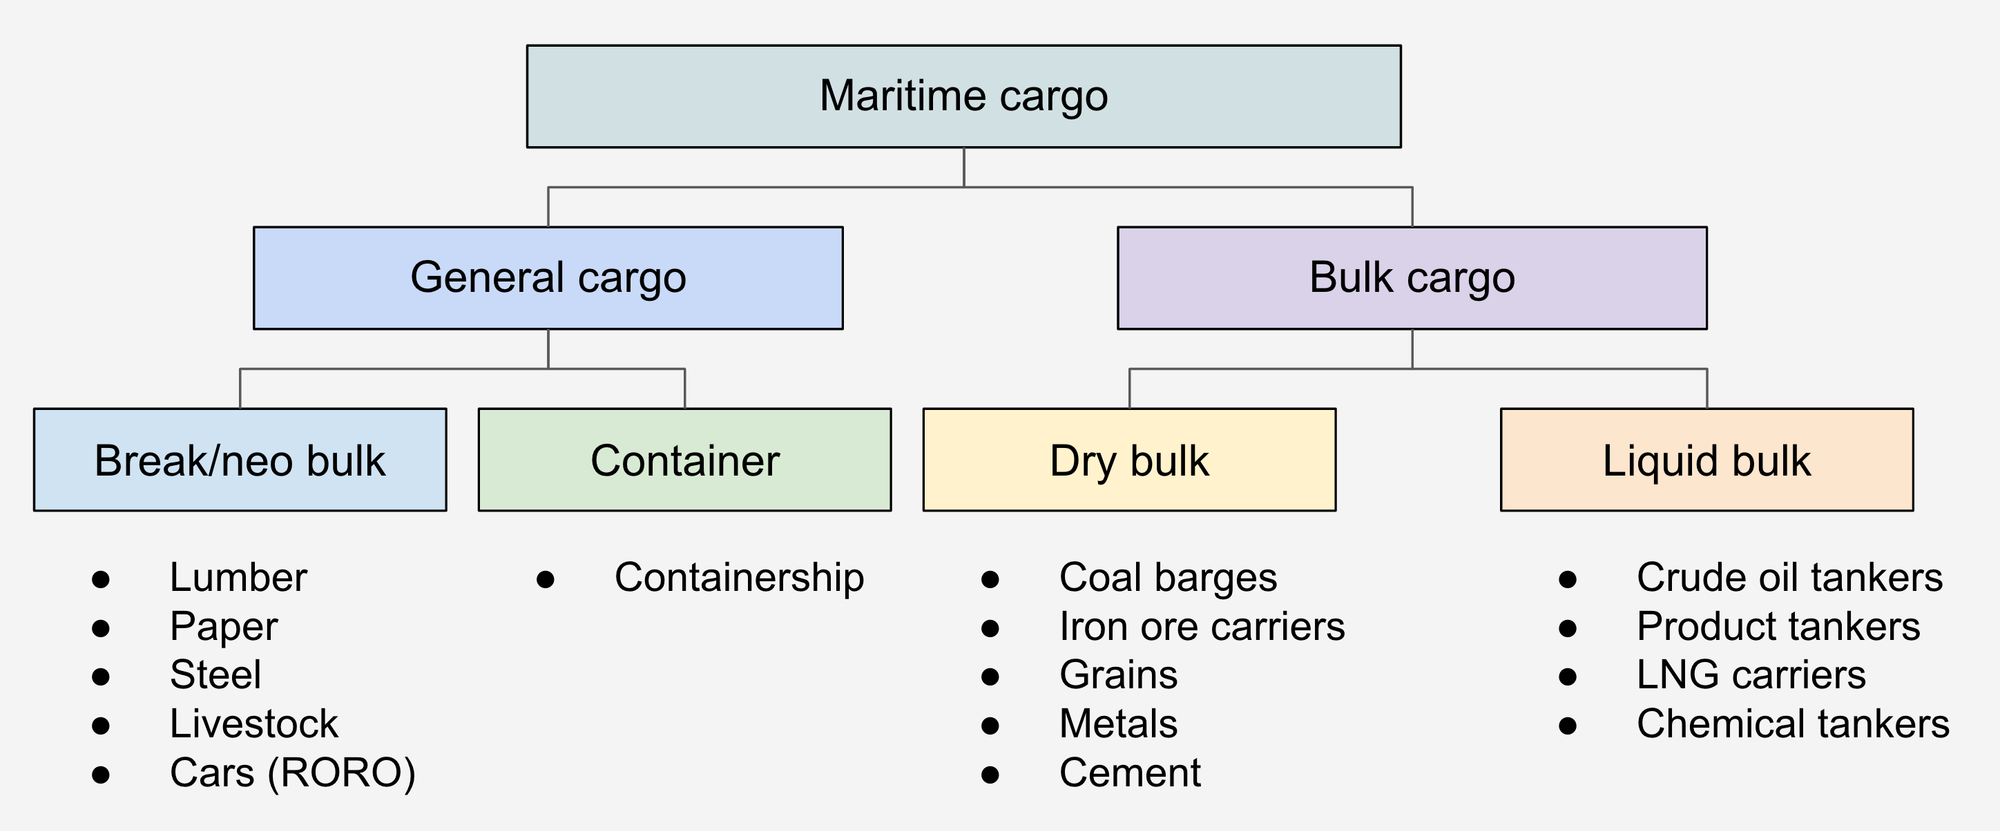
The complexity of construction between these ships differs greatly:
- For example, dry bulk carriers or tankers are among the least complex of larger ships. The competition among shipyards for these types of orders is, therefore, significant.
- At the other end of the spectrum, military vessels, LNG carriers or cruise ships are more complex to build and therefore produced at specific first-tier shipyards.
Since shipyards need to be close to water, they will be located along the shorelines in locations with greater water depth.
Today, most commercial shipyards are assembled in the Eastern part of the world. The major shipbuilders today are China, Korea & Japan, as rising labour costs have made shipyards elsewhere uncompetitive. European companies still dominate the cruise ship and yacht industries, as those tend to be complex to build.
State-owned shipyards tend to get a greater share of defence contracts. But they’re generally also worse run and often stupid about returns on capital. Private shipyards dominate the construction of higher-end, more technologically advanced vessels.
And then there’s a question of new builds vs repairs. Some shipyards focus only on new builds. Others are also engaged in the repair or upgrading of existing vessels. Finally, there’s the ship-breaking industry, which involves disassembling vessels by individuals who have experience working with hazardous materials.
In this post, I’ll focus almost exclusively on the commercial new-build market.
2. How shipyards make money
Shipyards take orders from customers such as shipping lines that want to expand capacity. If a shipyard has the capacity, it then proceeds to build the ships according to specifications.
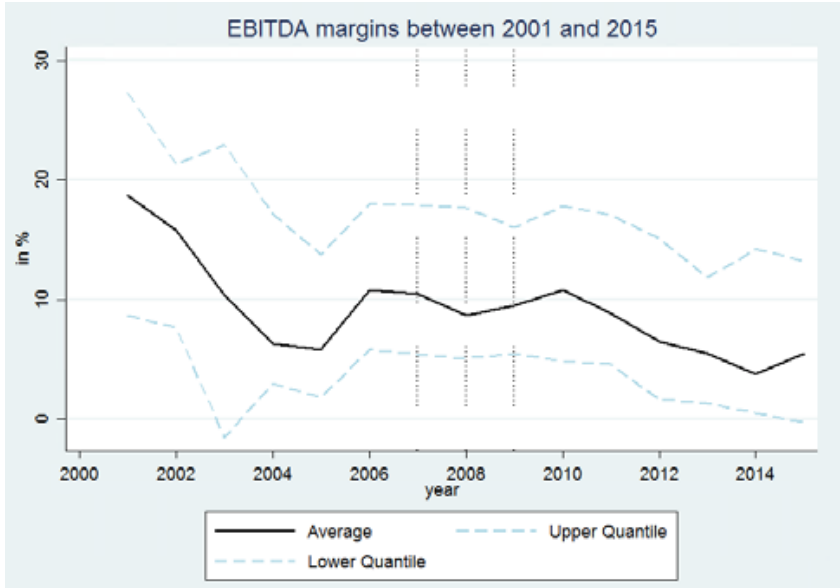
Ships are typically priced on a cost+ basis, with EBITDA margins of 5-10%. Here are the average EBITDA margins for shipbuilding companies between 2001 and 2015. They’ve trended lower over time due to competition from China. The below chart also shows the cyclicality of the industry, with cycles lasting up to a decade or more.
Ships are usually priced in US Dollars. The major expenses for a shipyard are raw materials and labour, in that order. In East Asia, the cost of labour is typically around 20-30% of the total manufacturing costs of a ship. This means that:
- A drop in a country’s currency - and resulting lower US Dollar wages - can have a major impact on a shipyard’s profitability
- Equally, sudden increases in wages can cause existing projects to become unprofitable, especially if the contracts don’t allow for wage adjustments.
- If prices for raw materials - especially steel - go up more than expected, margins will be squeezed as well.
A typical vessel might take 18-24 months to build. Smaller boats will take a shorter time, and very large crude oil carriers (VLCC), at the other end of the spectrum, might take up to 5 years. If the shipyard’s contract is fixed, as it often is, then the shipyard takes on the risk that the currency will appreciate, that wages will increase suddenly, or that raw material costs will go up.
In the short term, the availability of machinery and equipment, such as marine engines, can also constrain shipyards’ ability to finish orders on time. Any delays will inevitably reduce their profitability.
Another major factor for profitability is vessel prices. For example, after crude oil prices fell in 2014-15, new-build prices for tankers dropped precipitously, causing shipyards focusing on tankers to become less profitable.
Finally, there’s the question of utilisation. When a shipyard is operating near full capacity, profits will be decent. At the last cyclical peak for the shipyard market in 2008, utilisation rates hit 90%, and many shipyards earned a return on equity well above 20%.
What are the determining factors for new-build prices and utilisation? The demand for ships, on the one hand, and the supply of shipyard capacity. The interplay between these factors causes long-term cycles, which can last a decade, if not longer.
Sometimes, shipyards use their own balance sheets to build ships and then sell the vessels into the spot market upon completion to make sure they don’t stay idle for too long. But that’s obviously a risky strategy.
3. Regulation
The regulation for shipyards is centred around local content requirements, state-financing support and the environment, especially with regard to CO2 emissions.
Some countries have local content requirements. For example, in the United States, the Jones Act requires that Jones Act ships use a minimum amount of local components. In Asia, such requirements are rare.
In Korea and China, we’ve seen the government step in to support local shipyards to help them win orders. For example, the Korean government bailed out Daewoo Shipping & Marine a few years ago, seemingly for non-commercial reasons. And the Chinese state is known to offer shipyards attractive customer financing packages and bank loans with low-interest rates.
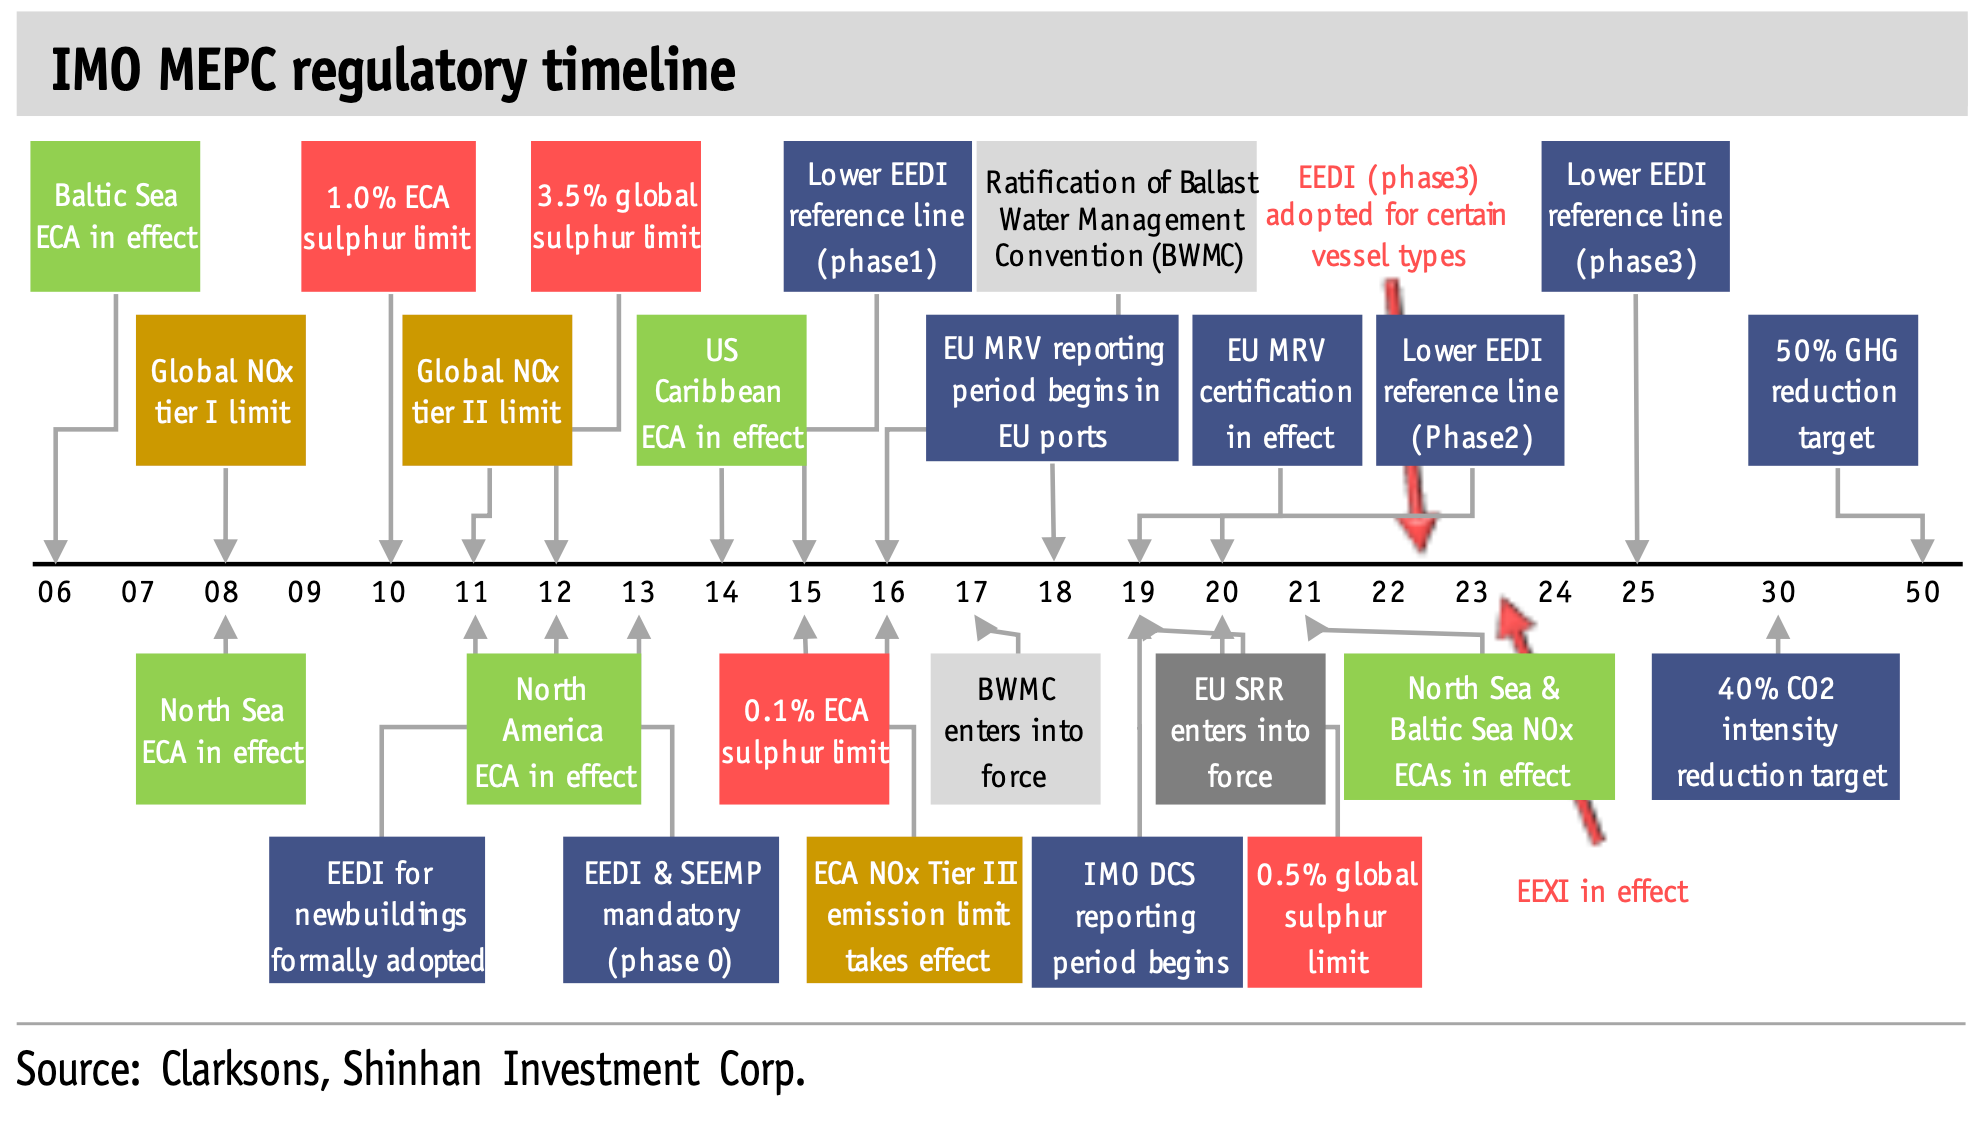
In terms of environmental regulation, the International Maritime Organization (IMO) will introduce the Energy Efficiency eXisting ship Index (EEXI) and the Carbon Intensity Indicator (CII) by the end of 2023 in an effort to reduce greenhouse gas emissions. Vessels will need to cut their CO2 emissions by over 20% initially. The CII will be assessed annually with stricter emission limits imposed each year by about 2% per year.
How can shipping companies meet these new requirements? By slowing down their ships, initially by 9% and then by another 0.7% each year.
They can also adopt new types of fuels that lead to lower CO2 emissions, including:
- LNG-fuelled vessels: Vessels powered by LNG emit 30% less CO2 than ships fuelled by bunker oil. Today, the combined order book in DWT of global shipbuilders has 22% LNG-fuelled vessels.
- Methanol: Reduces CO2 emissions by 11%, SOx by 95% and NOx by 13%. Methanol stays liquid at ambient temperatures, so existing infrastructure for liquid fuels can be used.
- E-LNG: A further transition to e-LNG, that is, LNG produced using electricity from renewable sources, could, in theory, lead to zero net emissions
- Ammonia: Emits 90% less CO2, but the technology is immature. Ammonia stays as a gas at ambient temperatures and only becomes liquid below -33 degrees Celsius, and it is also highly toxic. The first ammonia-fuelled ships are targeting completion by 2024-25.
Here are two scenarios presented by Norwegian rule-setter DNV GL: one where ammonia takes off and one bio-methanol ends up providing the majority of fuels for oceangoing vessels:

In any case, existing ships need to be either replaced or upgraded. So how will shipyards be able to assist with this shift to lower CO2 emissions?
- UK consultancy Shipping Strategy suggests that in order to be on track with the 2050 green goals laid down by the IMO, shipbuilding capacity will need to grow by 50% in the next five years.
- Since there are 28 years left to meet the target, over 3,500 ships a year need to be built or refit every year. That’s an incredible number, given the current shipyard capacity. It’s hard to make the numbers work.
- Also, it will take until the late 2020s before buyers will be confident enough to start ordering ships run on hydrogen and ammonia technology for commercial purposes. By that time, we’ll have closer to 20 years left to meet IMO’s targets.
So, in conclusion, current environmental targets will be an uphill battle for the global shipping industry to meet. And they may help ensure high shipyard utilisation for many years to come.
4. Supply & demand for shipyard capacity
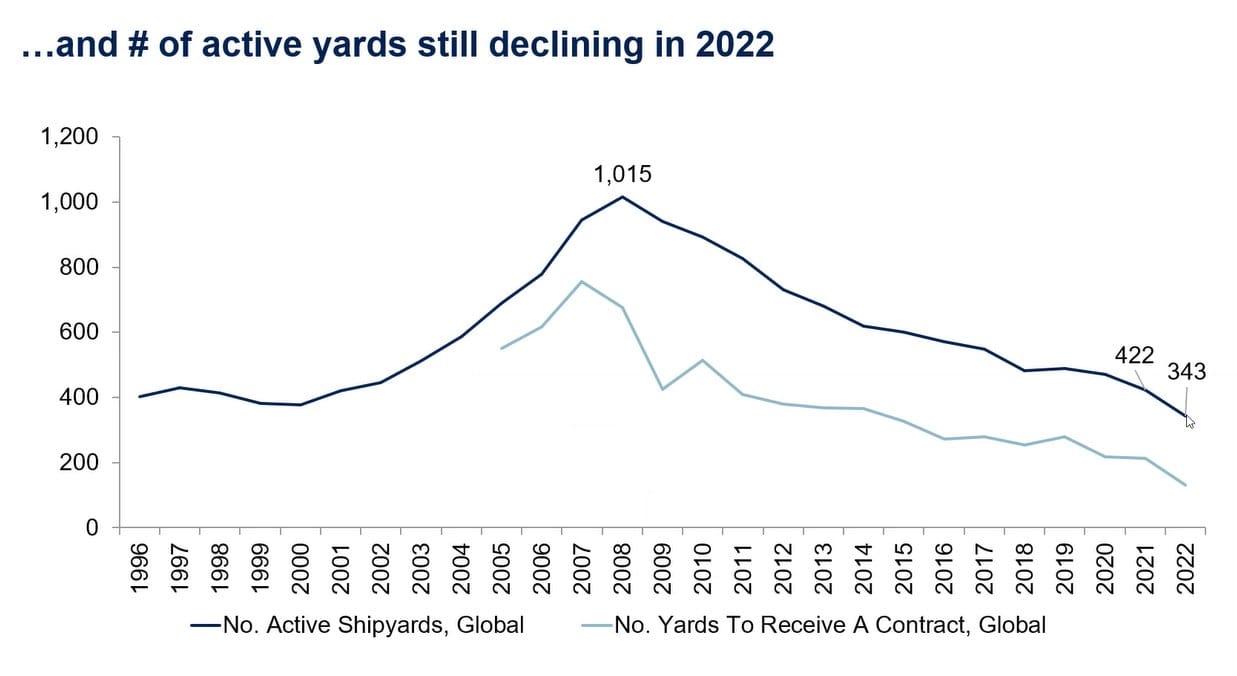
Shipyard capacity has been dropping for almost 15 years at this point. And the number of active yards continues to drop. The reason has been an incredibly tough climate for shipyards, especially 2nd tier shipyards that lack the capacity to build larger, more complex ships. It looks like we’ve gone full circle from the heydays of the 2000s when the number of active shipyards doubled.
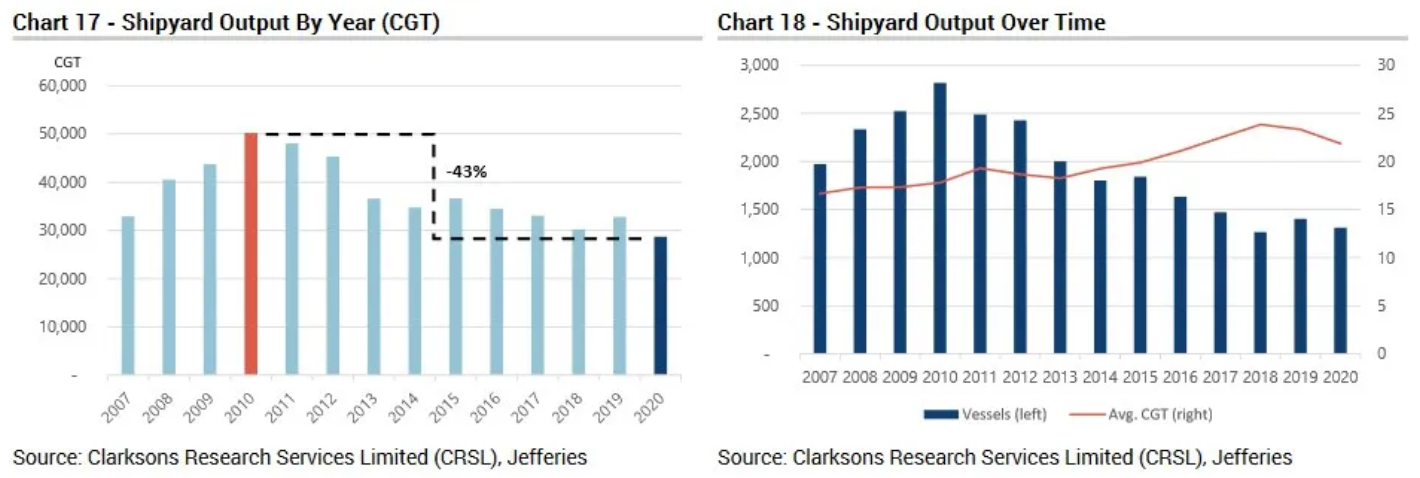
Shipyard output has dropped as well. It’s down about 40% from the peak in 2010. Meanwhile, the number of vessels built is down over 50%, as you can see here:
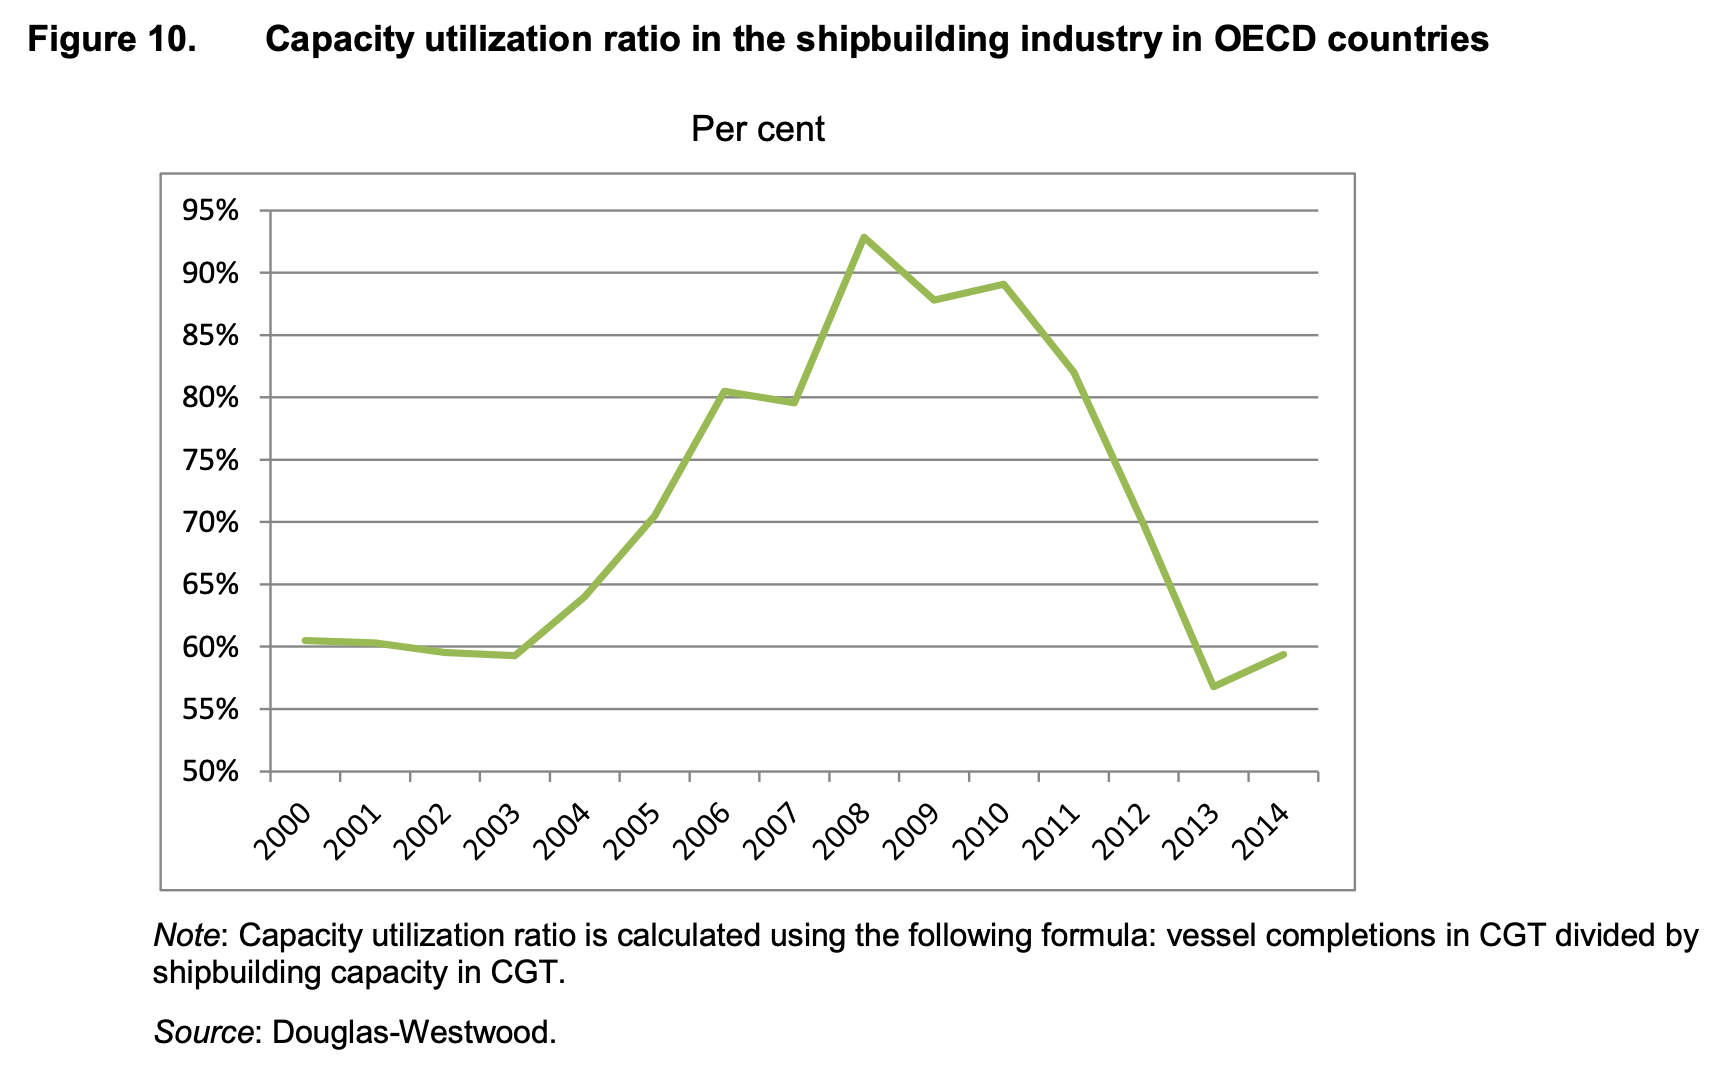
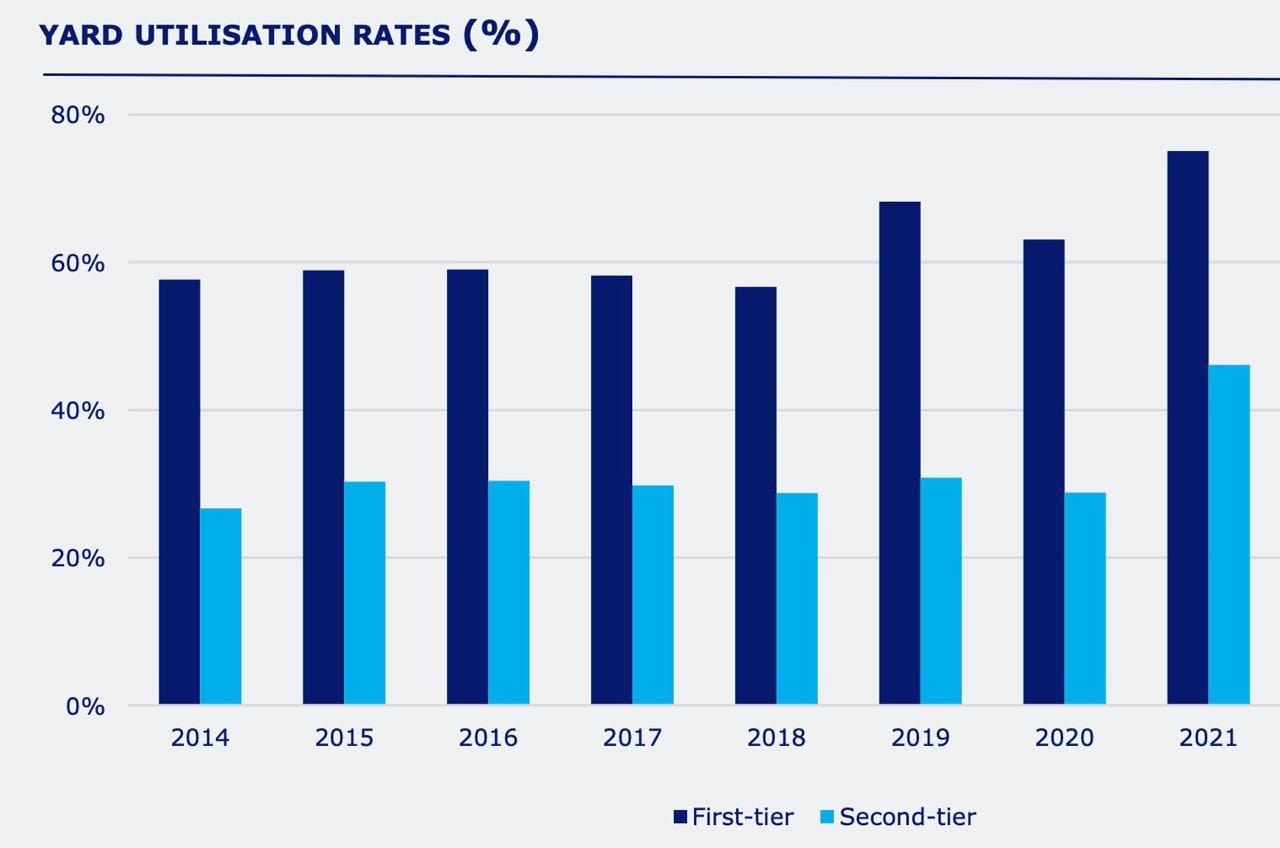
Yard utilisation rates reached 90% in the peak years of 2007-2010, as I’ve mentioned before. Today, they’re down to about 60% despite the drop in the number of active shipyards.
There’s also been a slight increase in tonnage per vessel, a trend that has benefitted the larger, tier-1 shipyards in Korea and elsewhere. The top 10 shipbuilding groups have increased their market share from just 41% in 2010 to 71% in 2021. This trend towards greater complexity and consolidation is showing no sign of stopping, given the ever-increasing requirements for more fuel-efficient vessels.
Today, there are currently around 100,000 vessels operating today across the world, with a combined capacity of around 900 million CGT. Global shipyard capacity is around 57 million CGT, so about 6.3% of the CGT of vessels in use worldwide.
Given that a ship lasts for 25 years (1/25 = 4%), the capacity seems to be about right to counteract yearly scrapping of 4% plus ton mile growth of about 2% per year (4% + 2% = 6%).
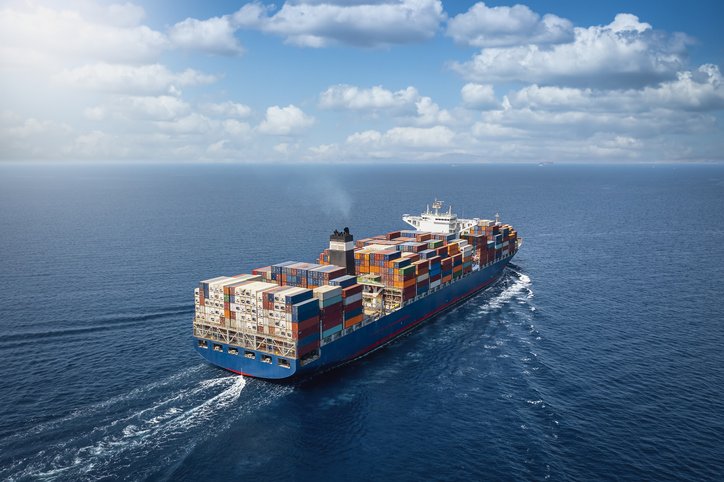
Construction of new ships was initially curtailed by COVID-19 in early 2020, as lockdowns caused shipyards to shut down temporarily. Then, as cash hand-outs were provided to developed market consumers staying at home, they went on a shopping spree, increasing the demand for goods transported in container ships. Container rates reached a multi-decade high by the autumn of 2021.
Although the container shipping bubble has now burst, the order book for containerships remains high at almost 30% of the on-water capacity, vs just 8% in 2020. Most of those orders went to Korean and Chinese shipyards.
Given the weaker profitability in the container shipping market, you’d expect some orders to be cancelled. And indeed, containership new-build orders have come down over the past six months.
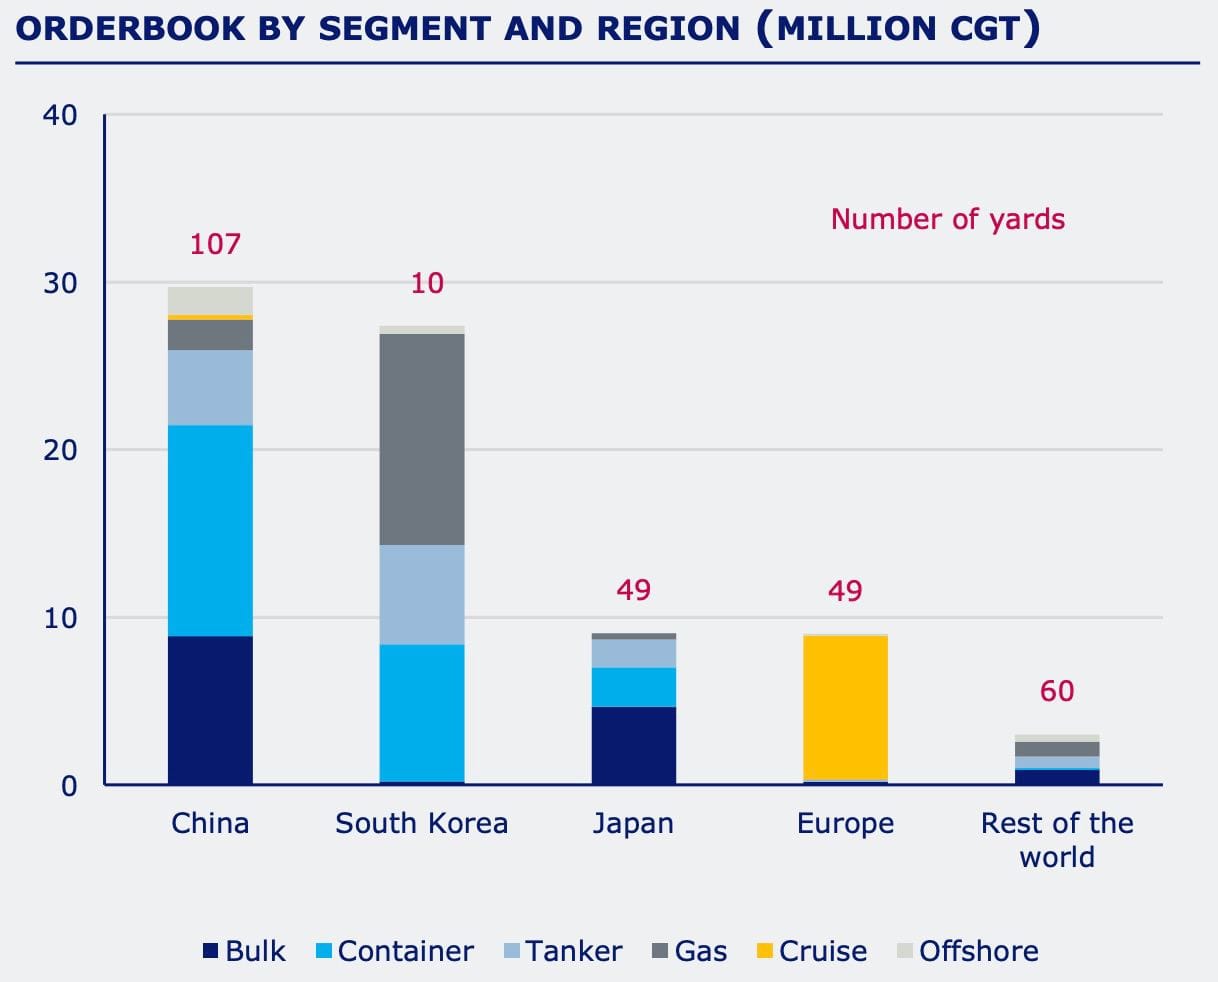
The demand for dry bulk ships remains muted. The Baltic Dry Index remains at average levels. And weakness in China’s property market has caused the demand for industrial commodities to drop.
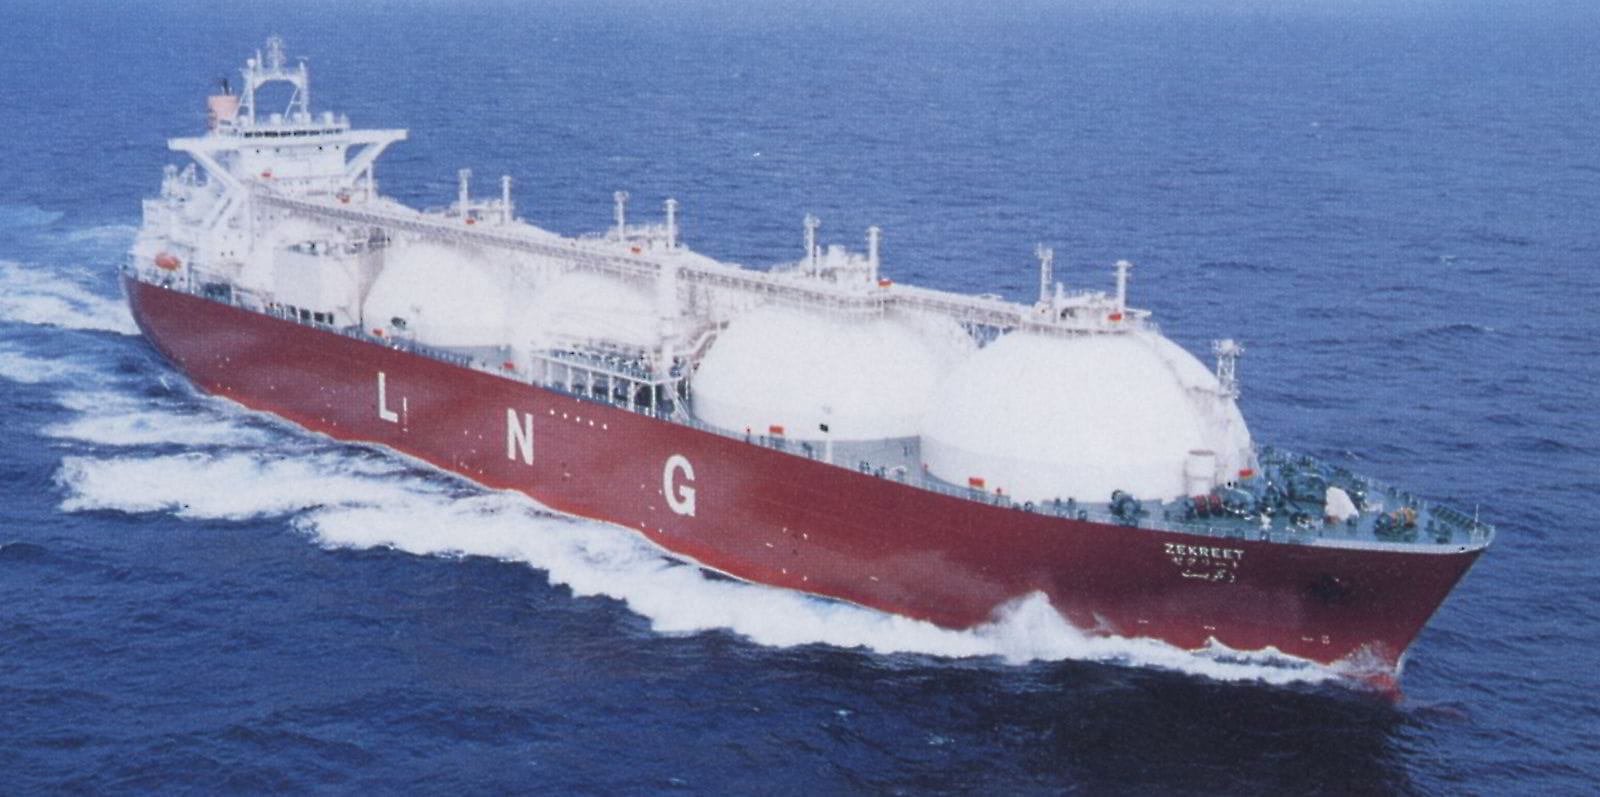
Finally, the demand for crude oil tankers has started to rise due to the war in Ukraine and a recovery in the demand for crude oil since COVID-19. LNG carriers are also in high demand thanks to Asian LNG prices at record highs.
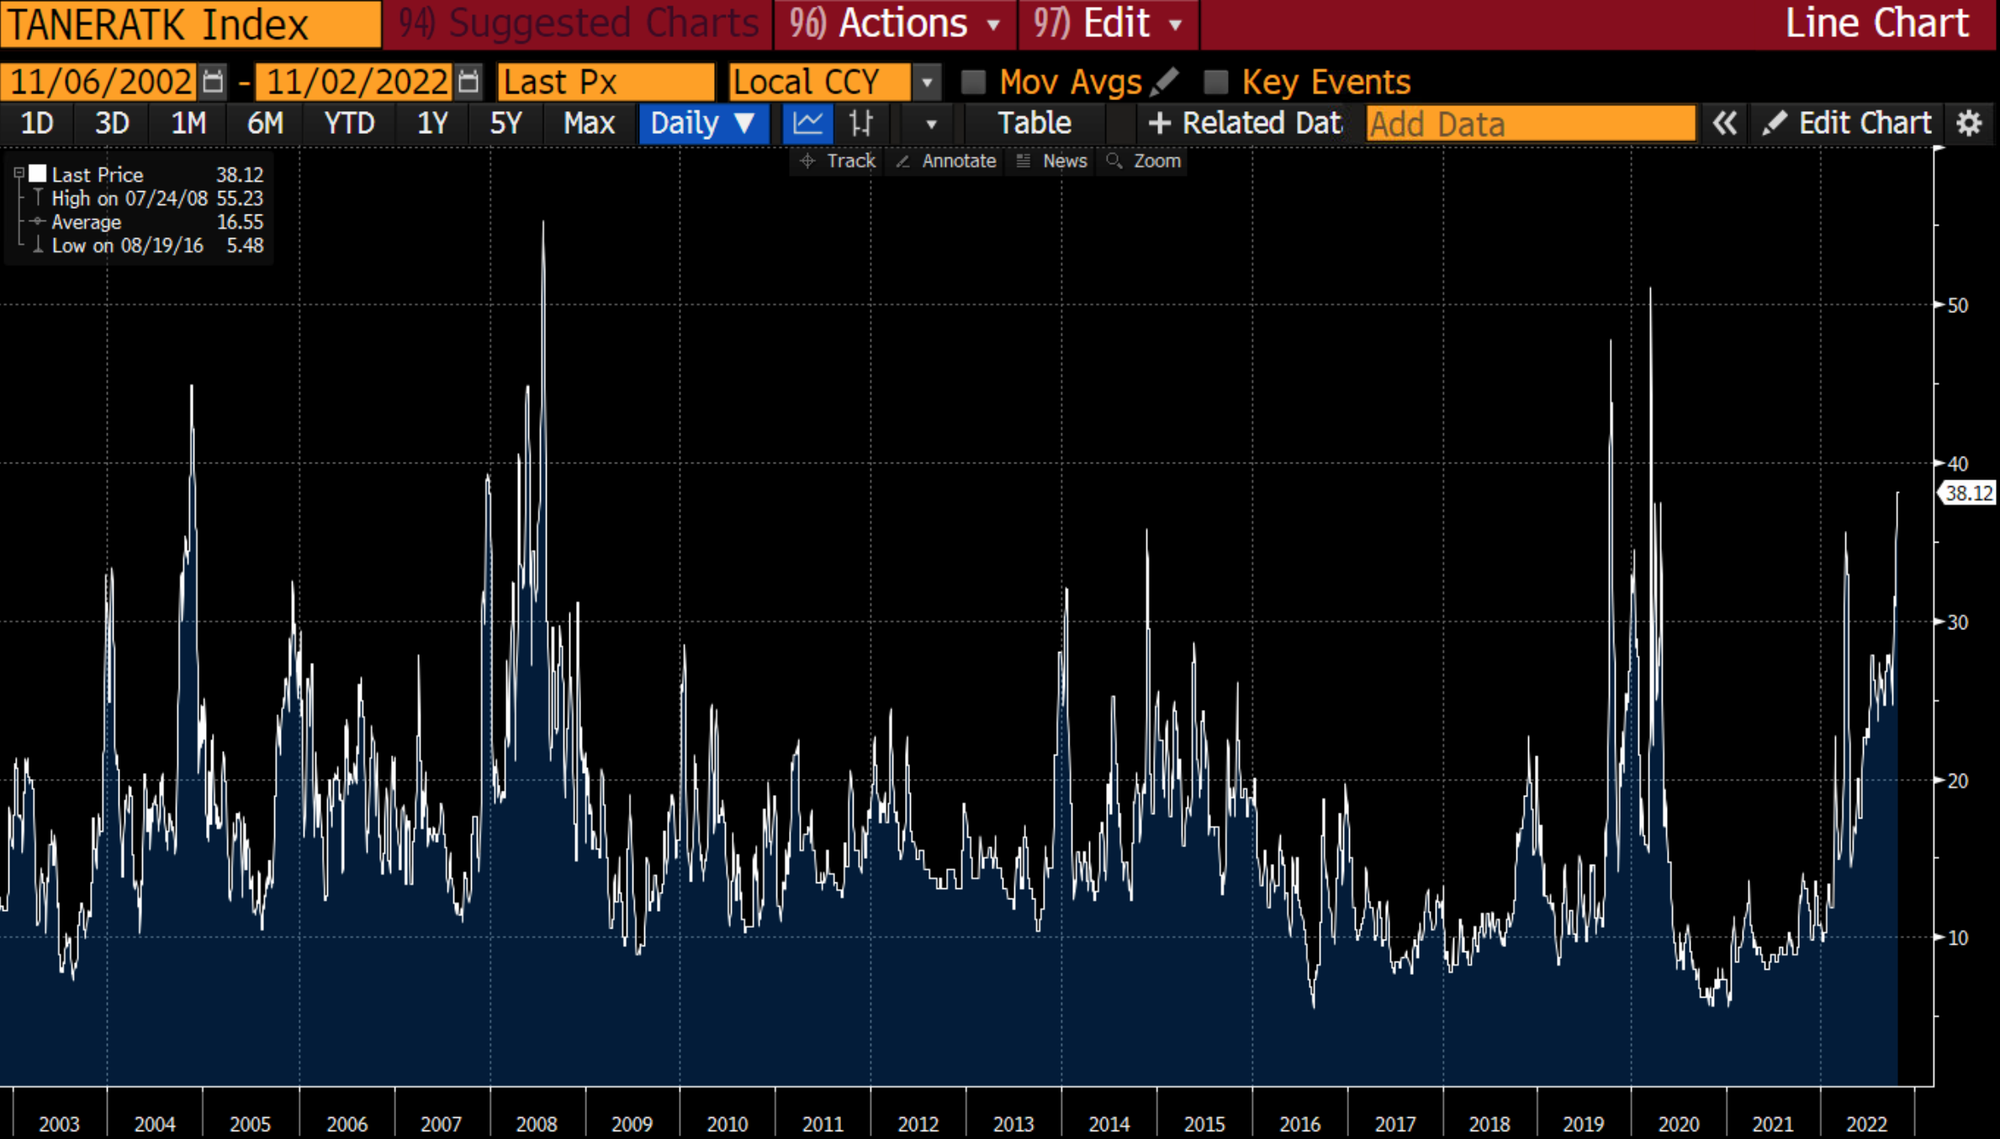
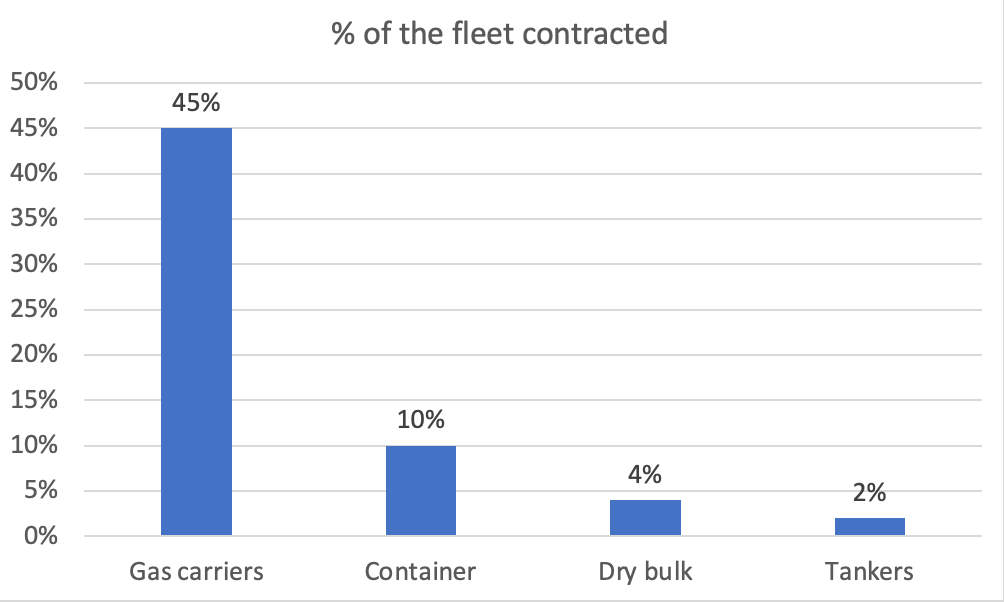
The contracting activity seems elevated for LNG carriers and containerships. Meanwhile, the equivalent of just 2% of the current fleet of tankers is contracted, suggesting a potential upside in tanker new-build orders going forward.
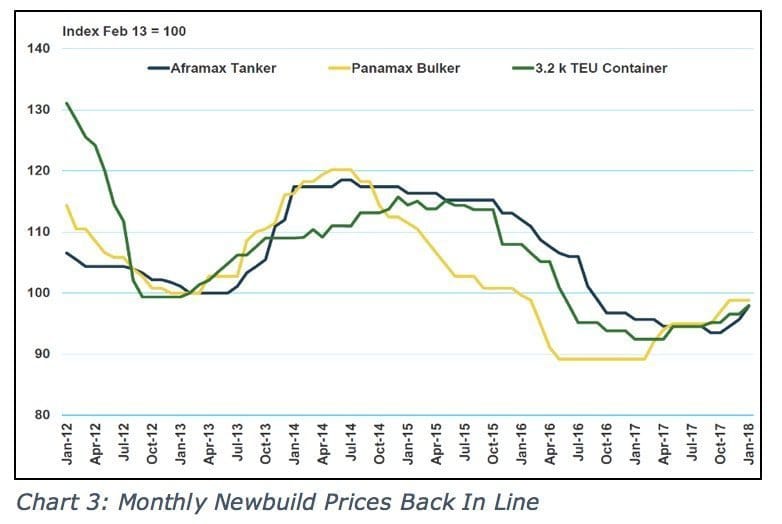
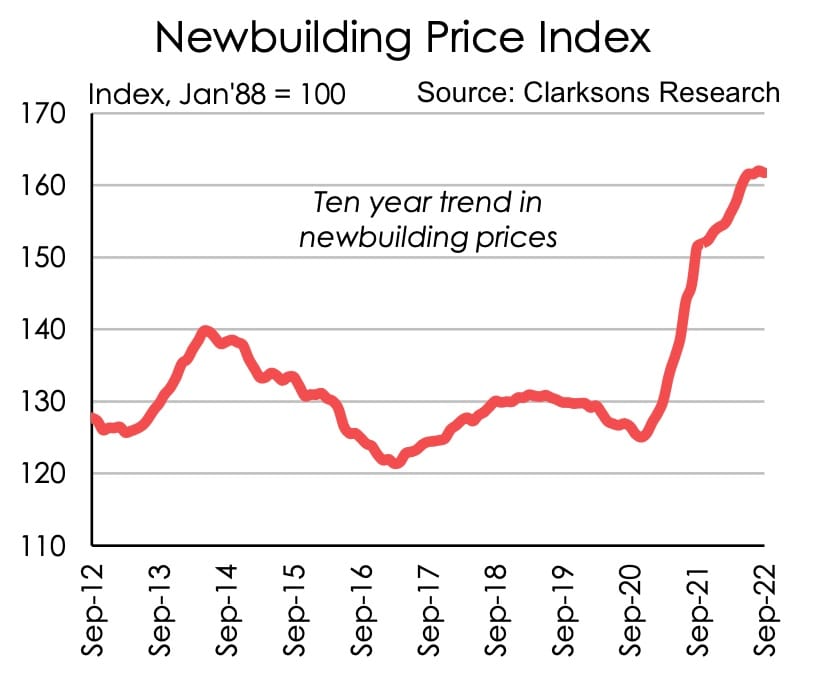
Another major event in 2021 was a record increase in prices for raw materials such as steel. Prices soared by 50% from December 2020 until early 2022. Steel prices are now finally coming down to earth.
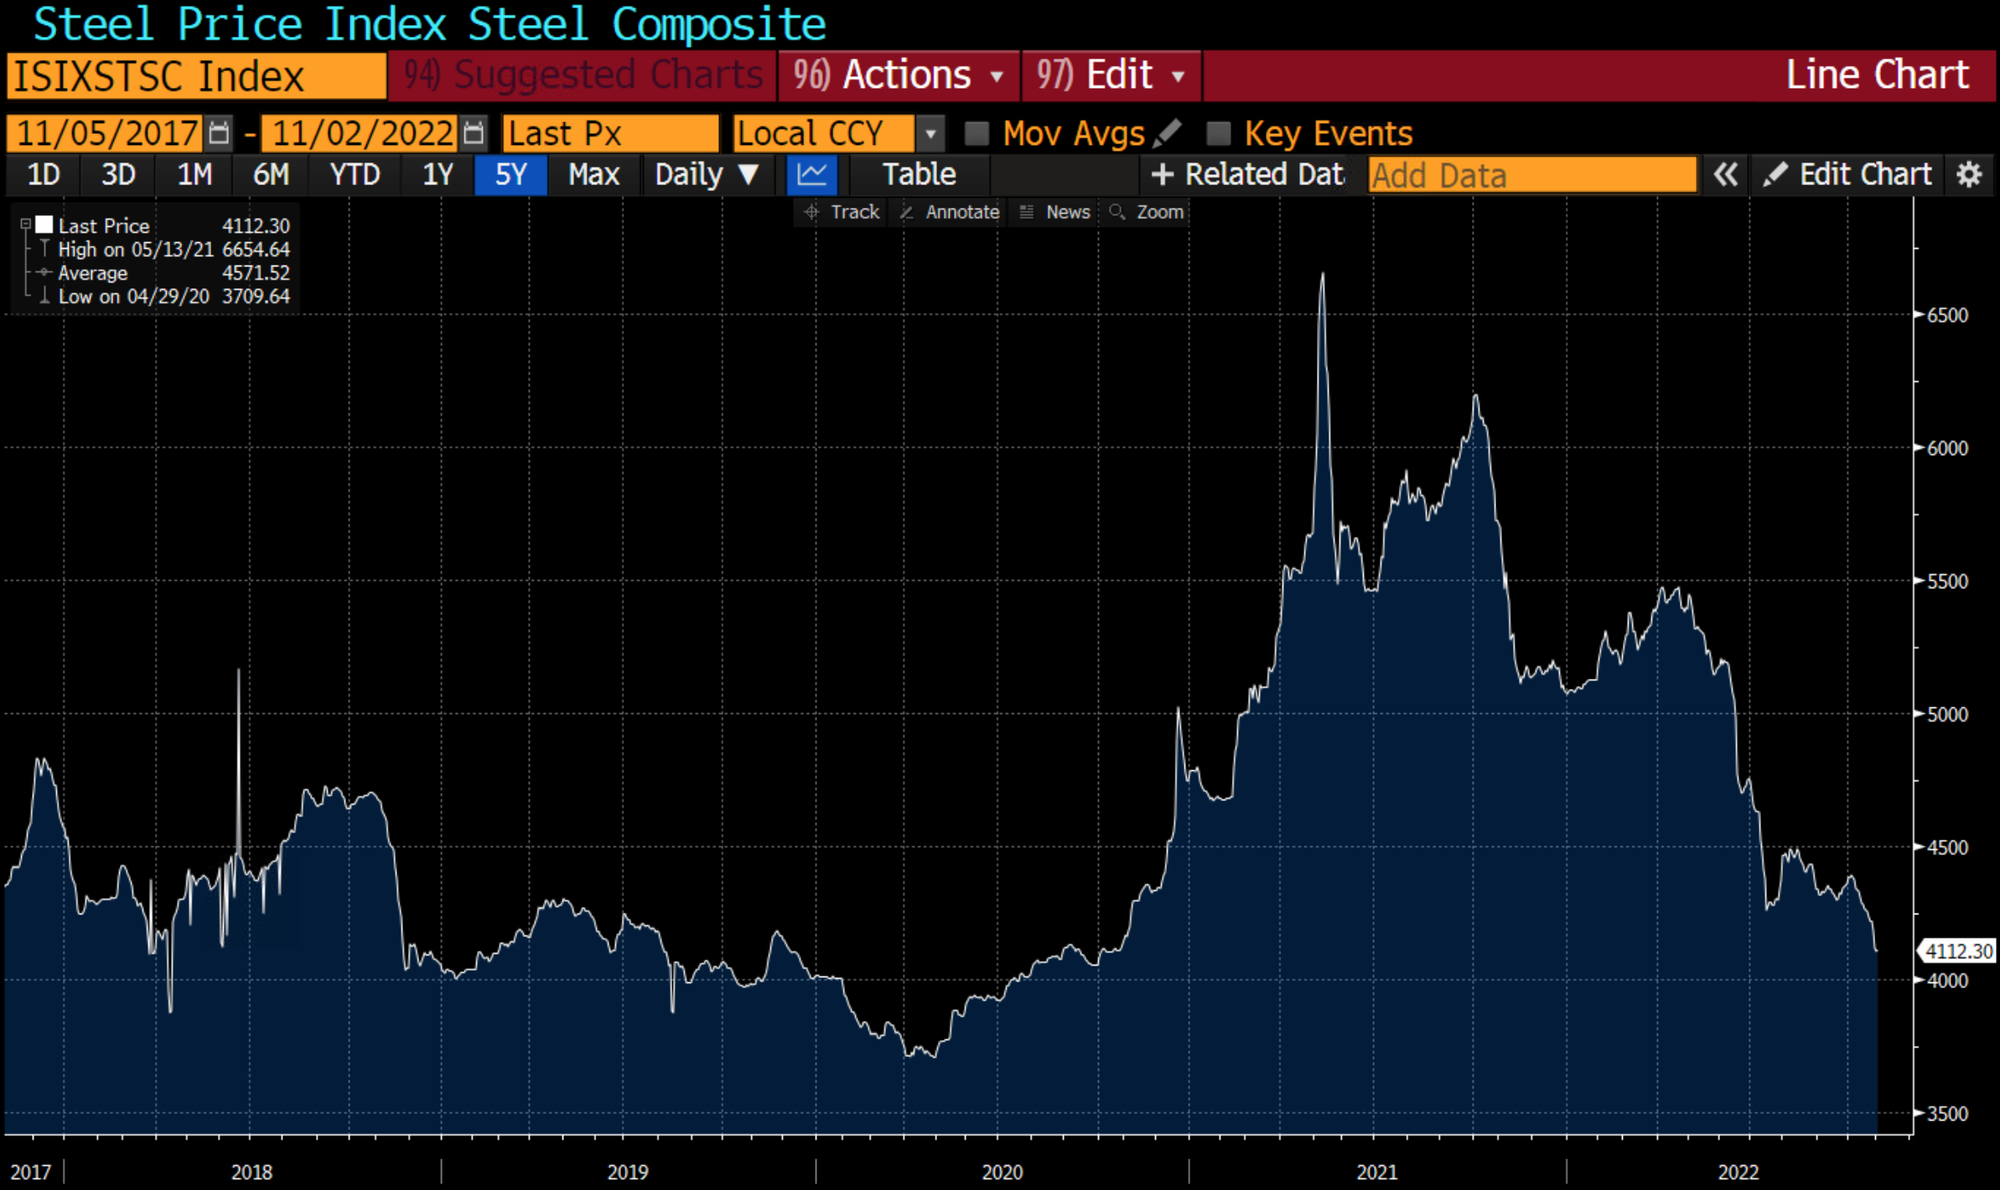
Those higher costs caused shipbuilding contracts signed in 2020 and early 2021 to become unprofitable. Much of the contracting until early 2021 was done without commodity price hedges. With shipyards squeezed by higher costs and becoming loss-making, they’ve started to raise their prices to account to make sure they make a decent profit. Thanks to this increase in new-build prices, shipyards are in a very good position to earn decent margins in 2023.
Another major trend has been the strength of the US Dollar, especially against the Japanese Yen. The weaker yen has improved the competitiveness of Japanese yards. As Mark Williams of UK Consultancy Shipping Strategy said:
“The incentive to talk to Japanese yards is clear”
On the other hand, Japanese shipyards tend to sell their ships to domestic buyers, priced in Japanese yen. That limits how much they can benefit in the short term.
This year, Chinese shipyards experienced production constraints due to recurring lockdowns to deal with COVID-19. Total shipyard output was up 11% last year to 33m CGT but is projected to fall to around 27m CGT in 2022 due to weakness in Chinese shipyard output.
Yard capacity has stayed flat since 2019. And now, most tier 1 shipyards are operating at a high 70% utilisation rate. The utilisation of tier 2 shipyards is closer to 40%.
It’s possible that shipyards will expand to meet the higher demand. But given that it takes over 2 years from ground breaking to first production, we won’t see a supply response to this uptick in demand until 2024/25.
In summary, COVID-19 led to a boom in orders for containerships and LNG carriers, keeping tier 1 shipyards busy for the next few years. We’re now seeing a slowdown in containership orders, though, and it’s unclear whether tanker orders will pick up the slack. In any case, shipyard profitability is likely to improve in 2023 as steel prices have come back to earth and 2021 vintage orders disappear from the backlog.
5. Shipbuilding industry map
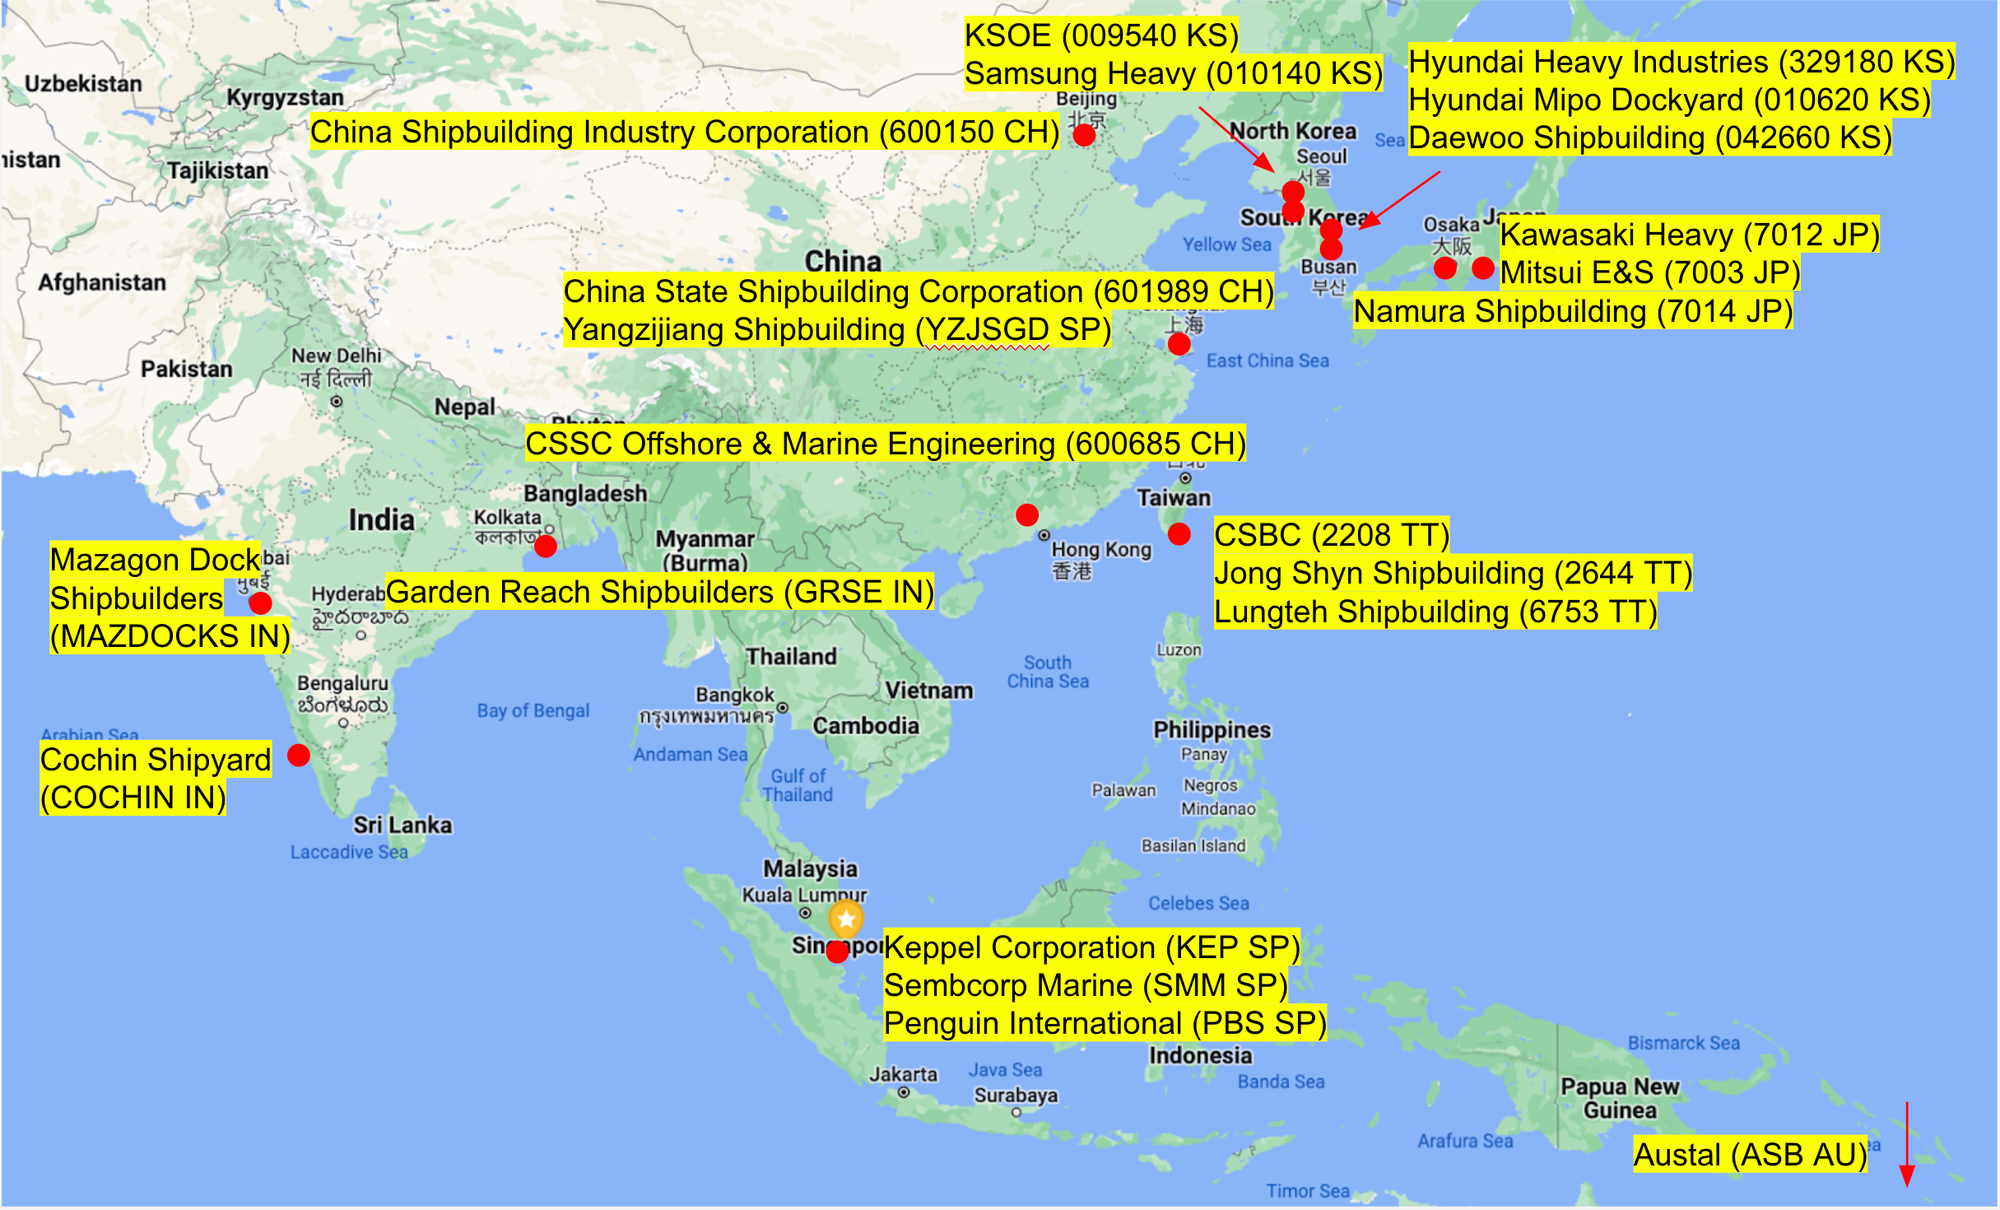
The world’s shipyards are typically divided into first-tier shipyards vs second-tier shipyards. The first-tier shipyards are able to produce ships longer than 122 metres and typically have the capabilities to build more advanced ships such as LNG carriers. Korea and Japan are a the forefront of technological developments.
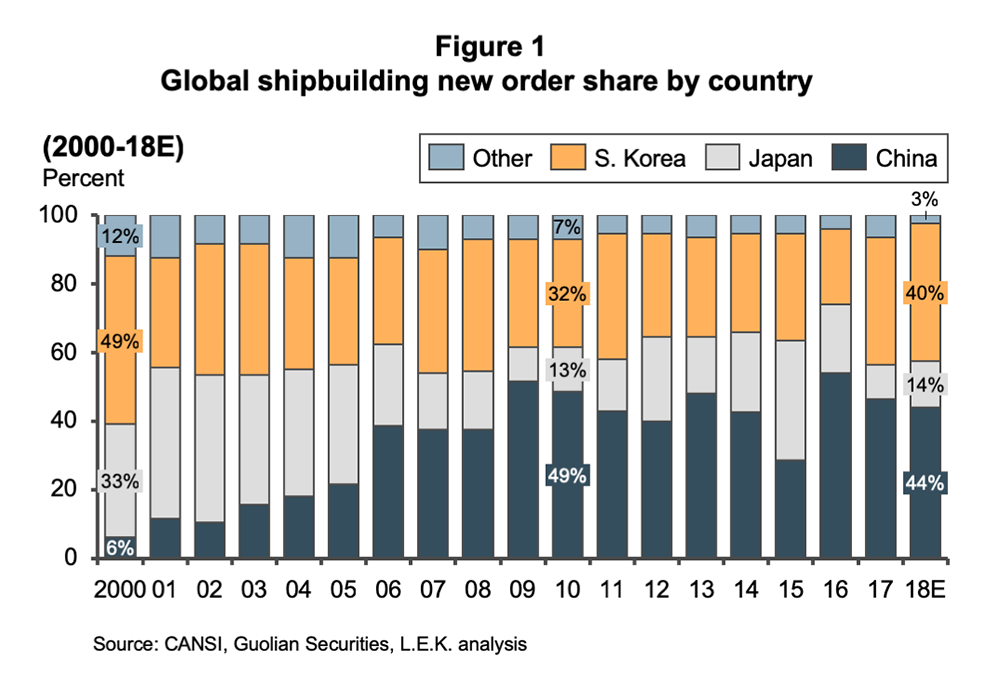
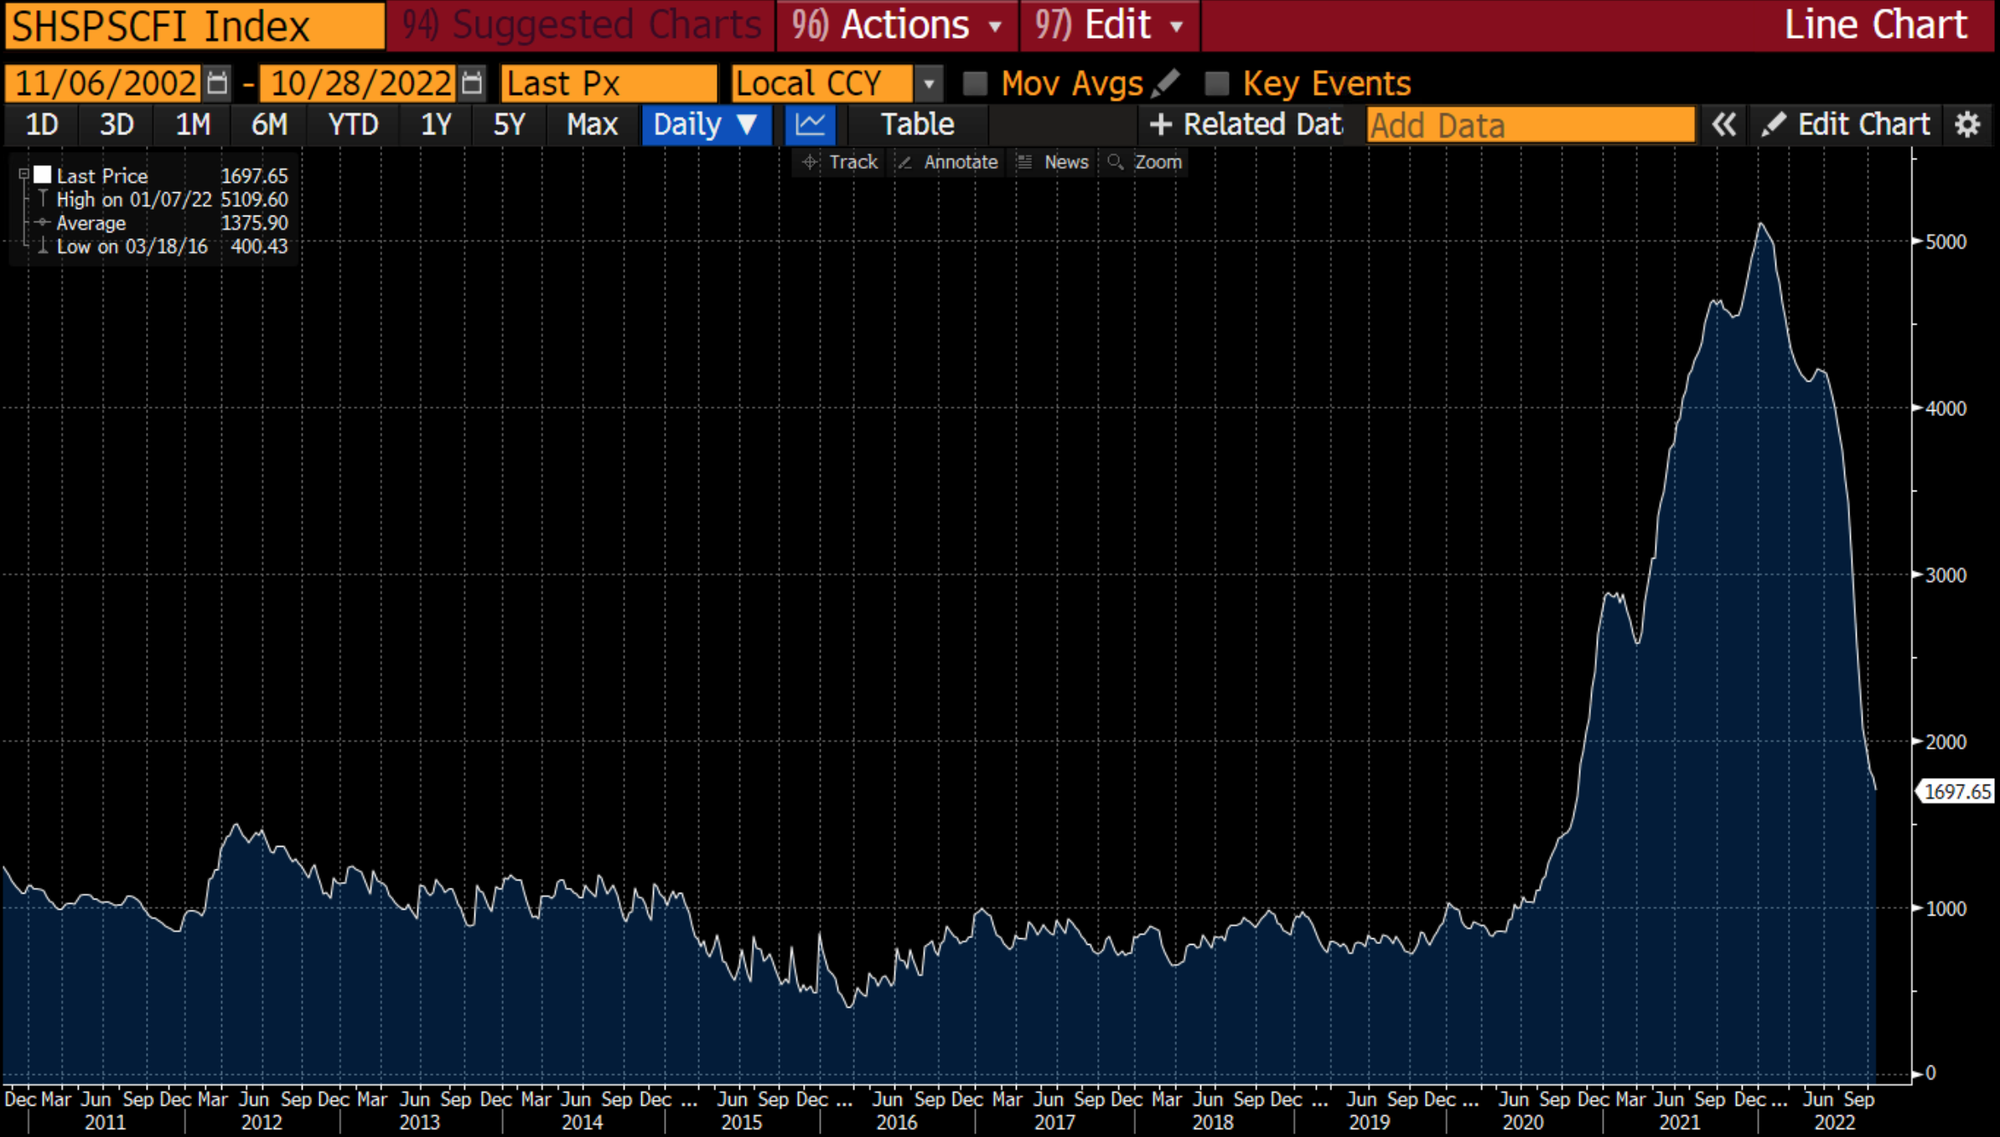
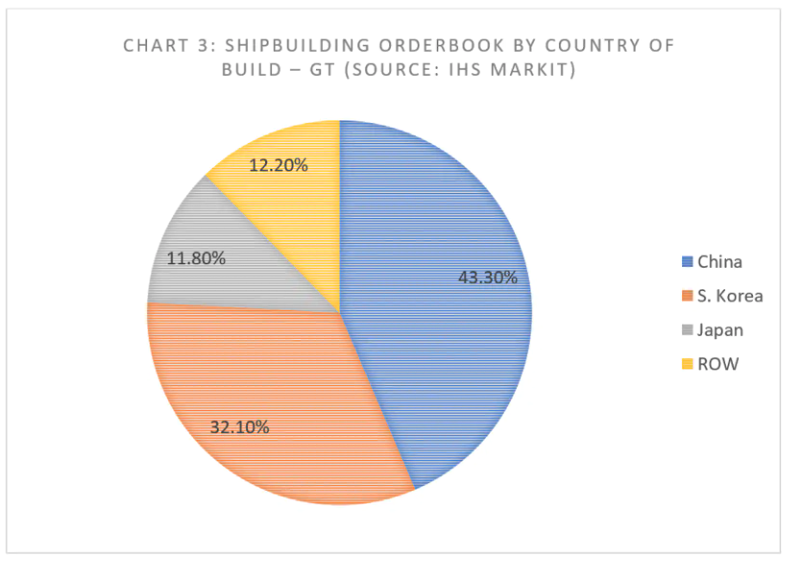
As of the end of 2021, China had 44% of the global shipbuilding order book, followed by Korea and Japan. Chinese shipyards are able to offer their customers attractive payment terms and financial packages supported by state-owned Chinese banks. The Singaporean yards are more focused on the construction of oil & gas rigs, which are not captured by the below data.
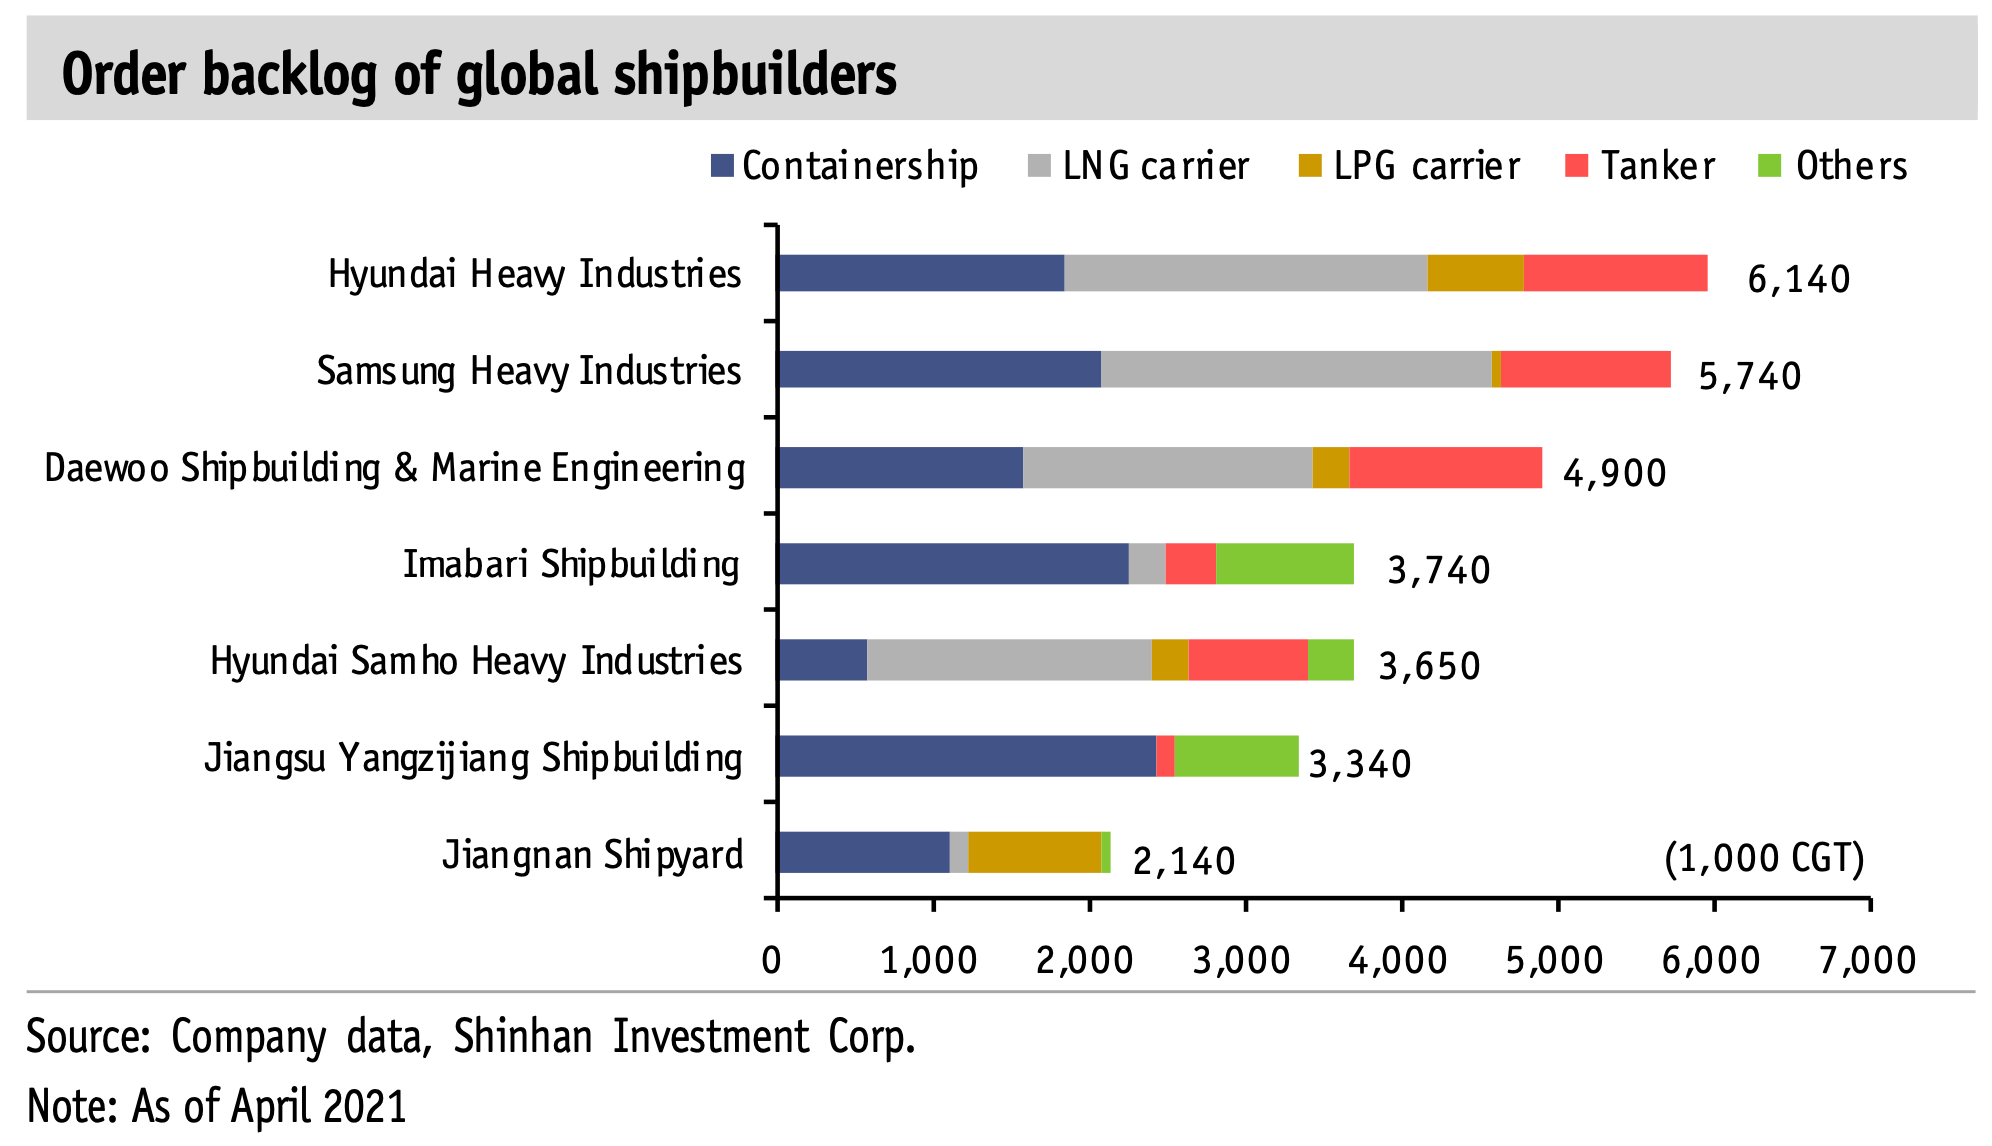
The below chart shows which companies have received the majority of the orders. The Koreans are at the top, followed by private company Imabari Shipbuilding in Japan and private Chinese shipyard Yangzijiang and SOE-owned Jiangnan Shipyard.
A word on valuations: shipbuilders receive cash in advance, and liability is added, called unearned revenue or deferred revenue. Instead of deducting all cash, I usually use the net number (cash - unearned revenue) when calculating the cash portion of a shipyard’s enterprise value. Bloomberg doesn’t adjust the numbers this way, so be wary of headline enterprise value multiples.
It’s also worth mentioning that shipyard stocks are incredibly volatile. P/E ratios should therefore be measured at mid-cycle revenues and margins or implied from P/B with their mid-cycle return on equity.
5.1. South Korea
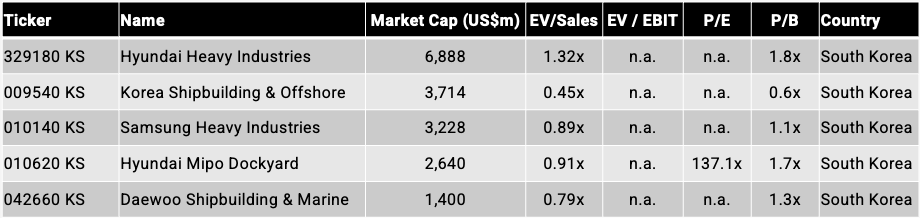
Korean shipbuilders are doing well, representing a large part of the global order book. The industry is dominated by three companies: Hyundai Heavy Industries, Daewoo Shipbuilding & Marine and Samsung Heavy Industries. The three Korean shipyards’ exposure to containerships / LNG carriers / tankers is more or less the same.
Separately listed Korea Shipbuilding & Offshore Engineering (KSOE) owns 80% of Hyundai Heavy Industries and represents the majority of its NAV.
There is optimism among investors about the Korean shipyards, as they are further ahead than the Chinese shipyards in their ability to create the gas-fuelled vessels that will be needed to reduce CO2 emissions in line with IMO’s requirements. The Korean shipyards also represent a large portion of the global order book for new vessels.
The Korean shipyards also have the ability to build complex ships such as LNG carriers. That helped them bag a massive order from Qatar Petroleum recently. Hyundai Heavy and Daewoo together build around 60% of the world’s LNG carriers.
Out of Korea’s three major shipyards, Hyundai Heavy Industries (HHI) is the largest. It has a 10% market share in the global shipbuilding industry. Its shipyard stretches over four kilometres at the Mipo Bay in Ulsan in Eastern Korea, where it has ten dry docks. Hyundai Heavy Industries re-listed on the KRX through an IPO last September. The retail tranche of the IPO was heavily oversubscribed, which might explain why the stock trades at a premium to its peers in terms of EV/Sales. HHI is also the global leader in marine engines (~30% market share), as well as LNG and methanol dual-fuel engines. This vertical integration gives it an edge over its peers.
Samsung Heavy Industries has strength in LNG carriers, shuttle tankers, drill ships and FPSOs. That may explain the weakness the company has experienced since the oil price drop in 2014. Today, the order book also includes containerships, even though historically, they were not Samsung Heavy’s strength. The company also produces machinery and equipment used on ships, including control devices and gantry cranes. Samsung Heavy’s Geoje shipyard, close to Busan, has three dry docks and five floating docks.
Daewoo Shipbuilding operates another major shipyard on Geoje Island next to Busan in South Korea. It has somewhat larger exposure to tankers than Samsung Heavy and Hyundai Heavy, but the differences are not material. Daewoo’s debt levels are the highest among the three, and the company nearly went bankrupt in 2016 after the South Korean Board of Audit and Inspection found a KRW 1.5 trillion accounting fraud in the company’s books. A government bailout helped the company stay afloat. In 2019, Hyundai Heavy Industries struck an agreement to acquire Daewoo Shipbuilding, but the deal was rejected by the European Union due to antitrust concerns. So Daewoo Shipbuilding remains a separate company.
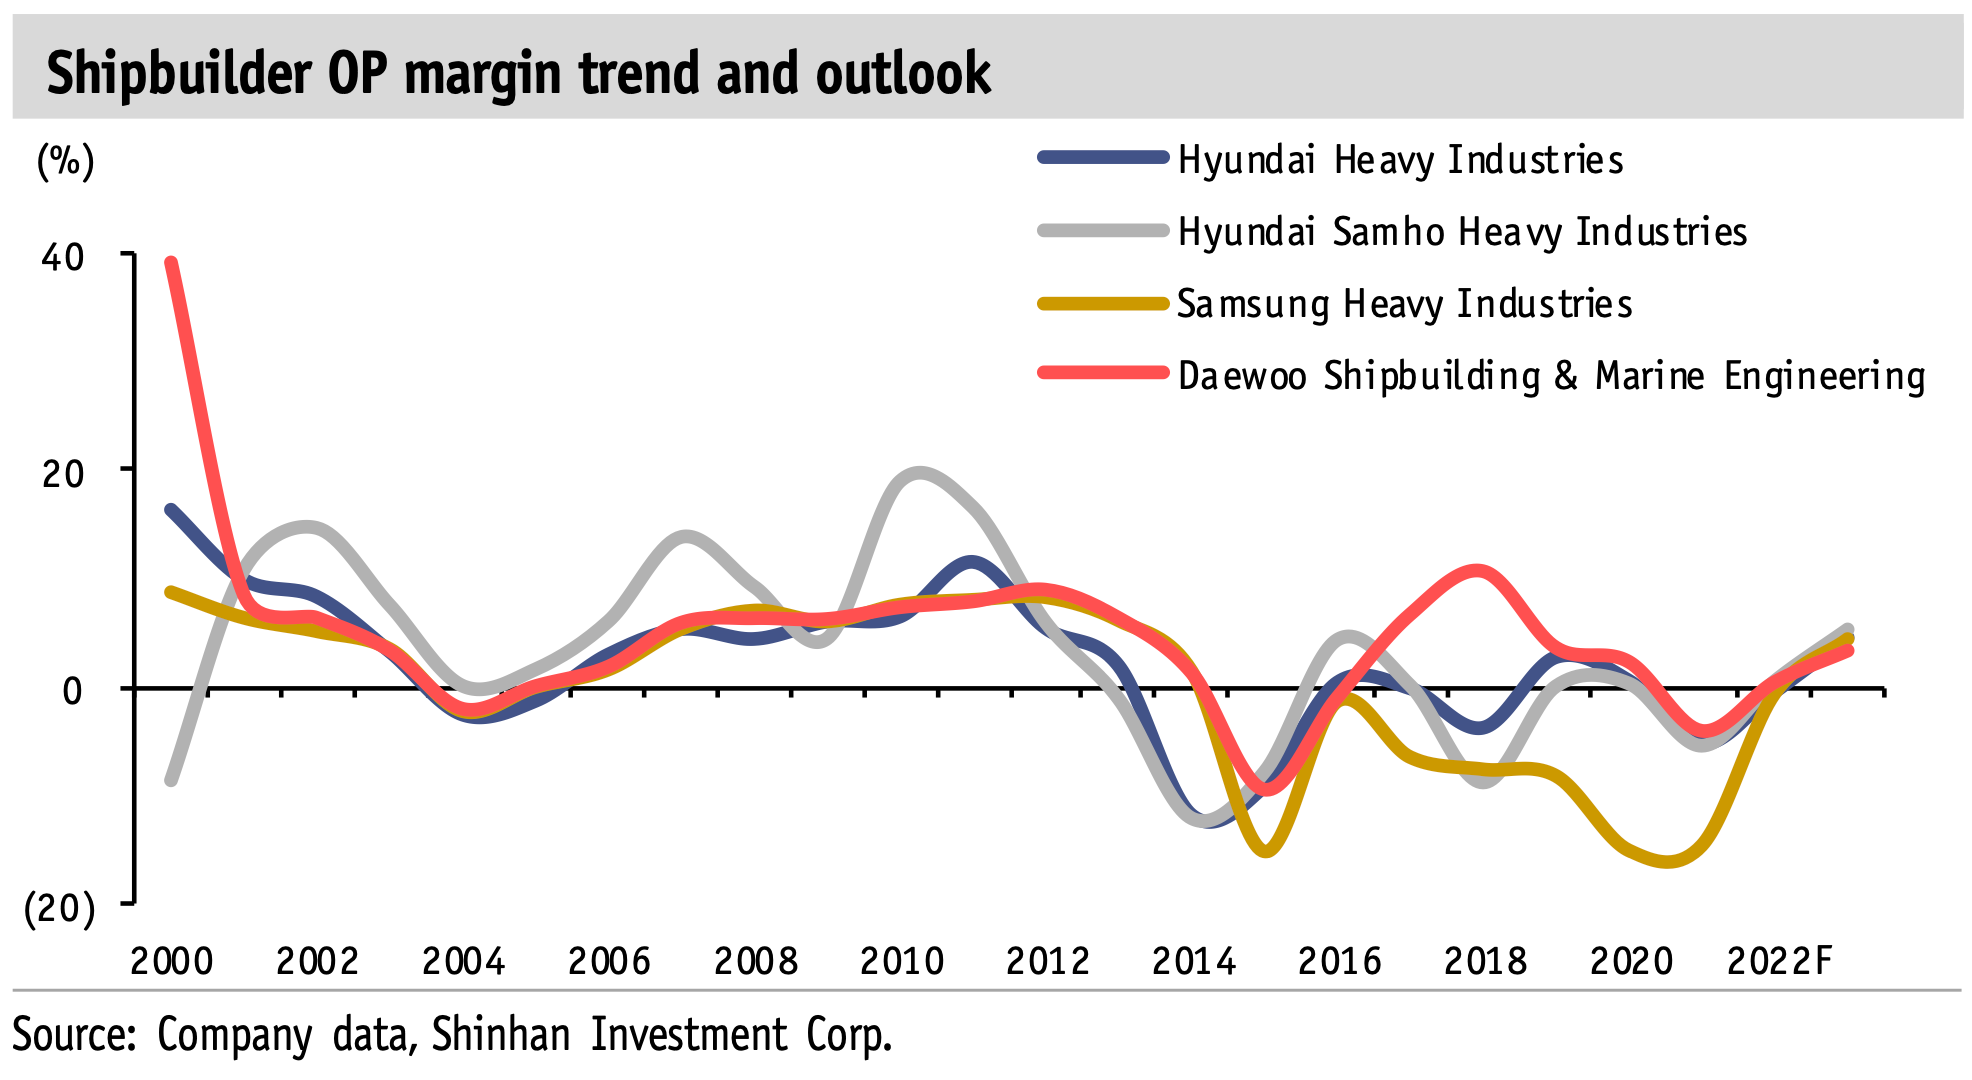
Out of the three, Hyundai Heavy has enjoyed more stable margins, though they have been volatile throughout the cycle. Samsung Heavy has been loss-making for most of the past 10 years due to the downturn in tanker orders from 2014 onwards.
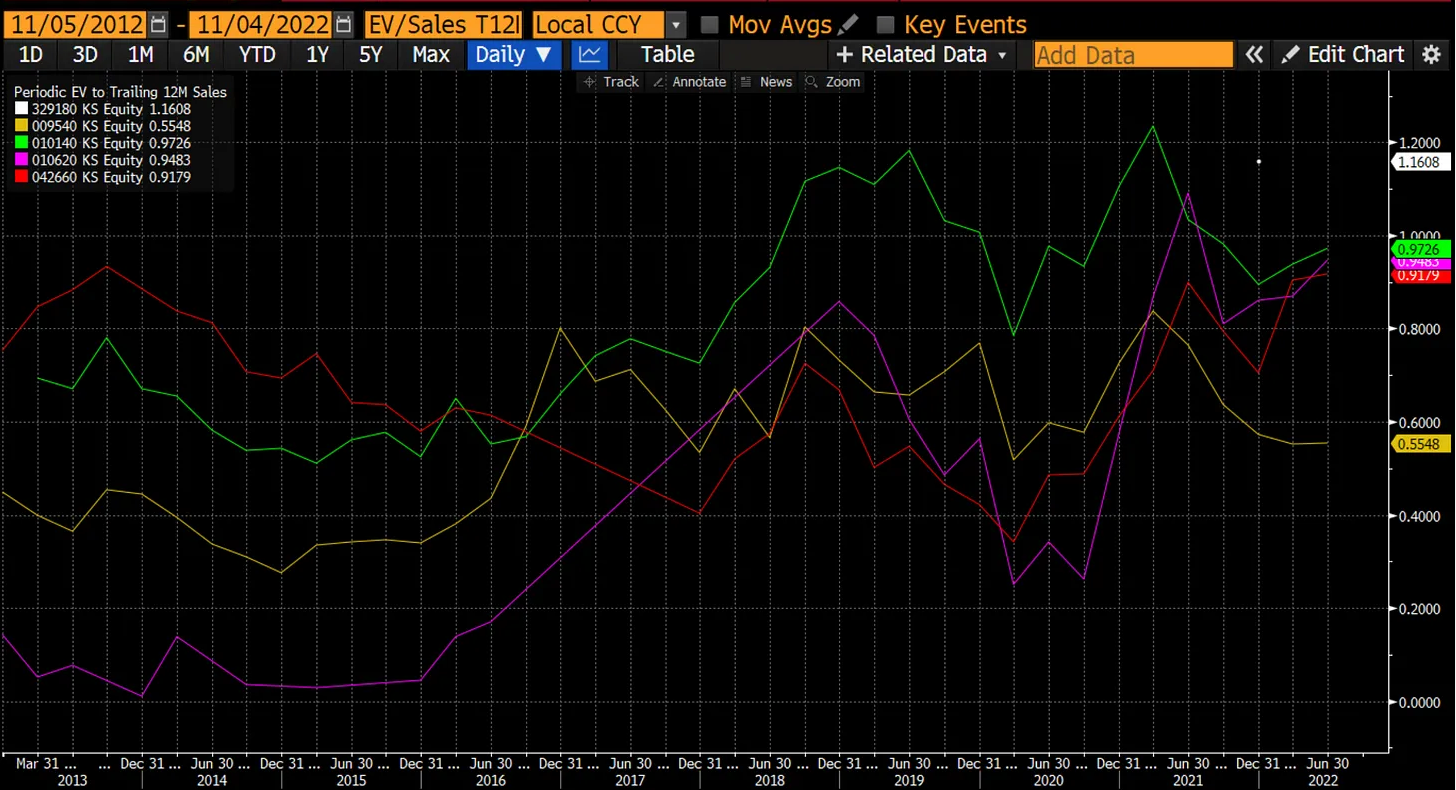
With EV/Sales of 0.9-1.3x and P/B of 1.1-1.8x, neither of the Korean shipyards trade at low multiples. It’s anyone's guess where margins will end up. But using typical cost+ assumptions of around 8% operating margin, it will be hard to see these shipyards trade much below 10x EV/EBIT.
5.2. China
China’s shipbuilding industry is dominated by state-owned enterprises and the government’s support of them through state-owned banks.
In 2019, the China State Shipbuilding Corporation (CSSC) and China Shipbuilding Industry Company (CSIC) merged to create the largest shipbuilder in the world with a ~20% market share. The two companies had originally split in 1999 as part of Zhu Rongji’s SOE reform to increase competition in the shipbuilding industry. At that time, CSIC oversaw shipyards in the north and west (e.g. in Chongqing), and CSSC oversaw those in the south and the east.
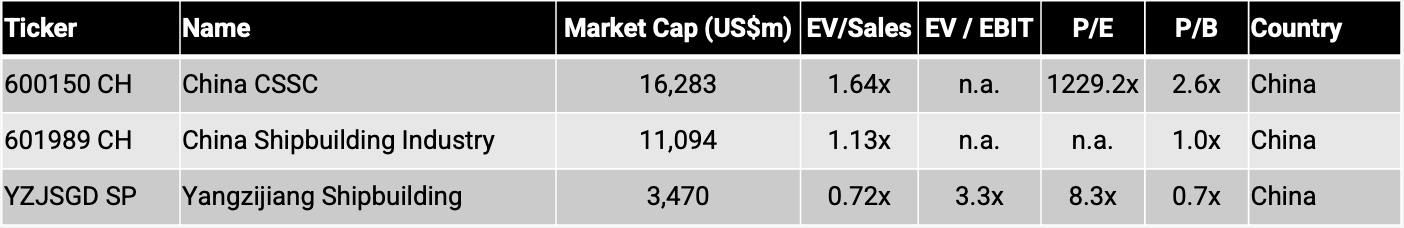
The two A-share listed entities China CSSC Holdings and China Shipbuilding Industry Company Limited (CSIC) are subsidiaries of the combined, merged parent company. The two listed companies continue their (primarily commercial) businesses under a single parent. Some of their shipyards include Jiangnan Shipyard, Yantai Raffles Shipyard, Guangzhou Wenchong Shipyard and many more. The companies are not particularly profitable.
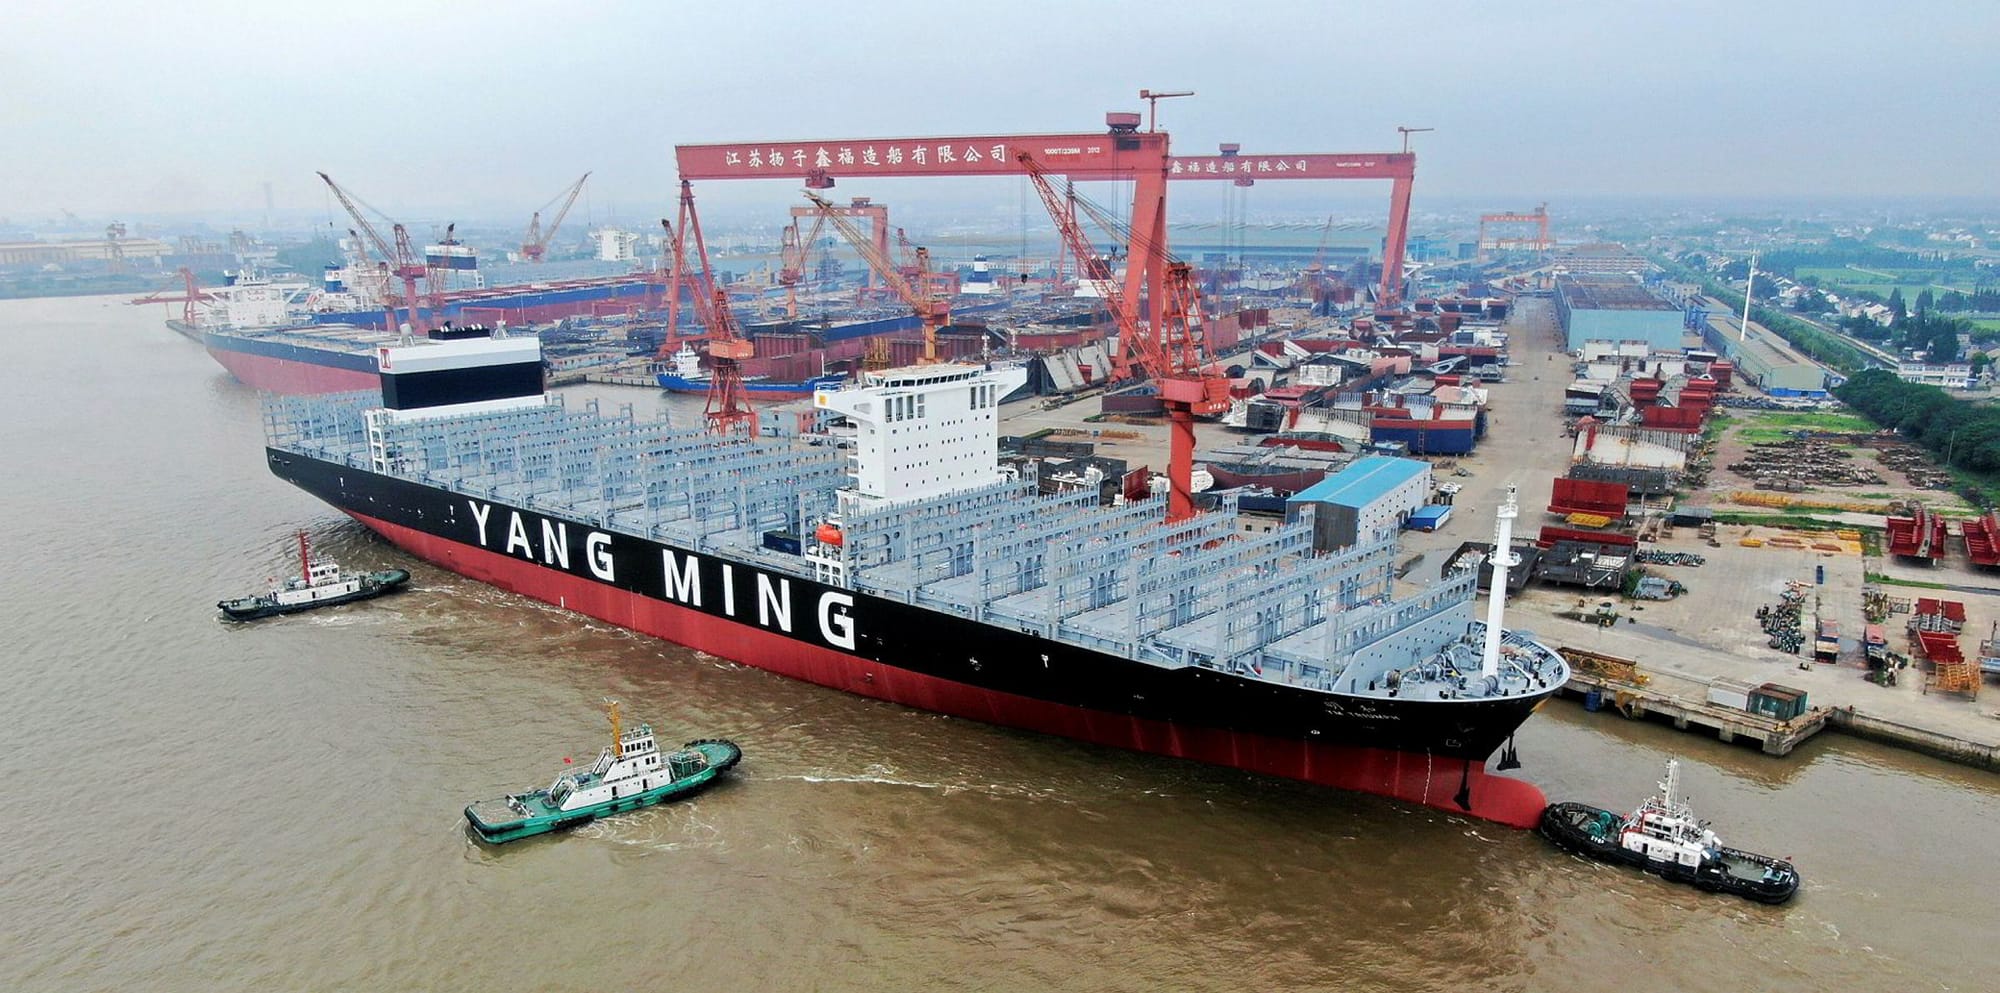
There is also a private shipyard in China called Yangzijiang Shipbuilding, listed in Singapore. It’s one of the most profitable shipbuilders in China, with a return on equity well above 10% across the cycle. I don’t fully understand how Yangzijiang is able to achieve this profitability. It has the capability to produce ultra-large containerships, large bulk carriers and LNG vessels. Yangzijiang’s yards are full through 2024 with an order book of over US$8 billion, mostly from containerships.
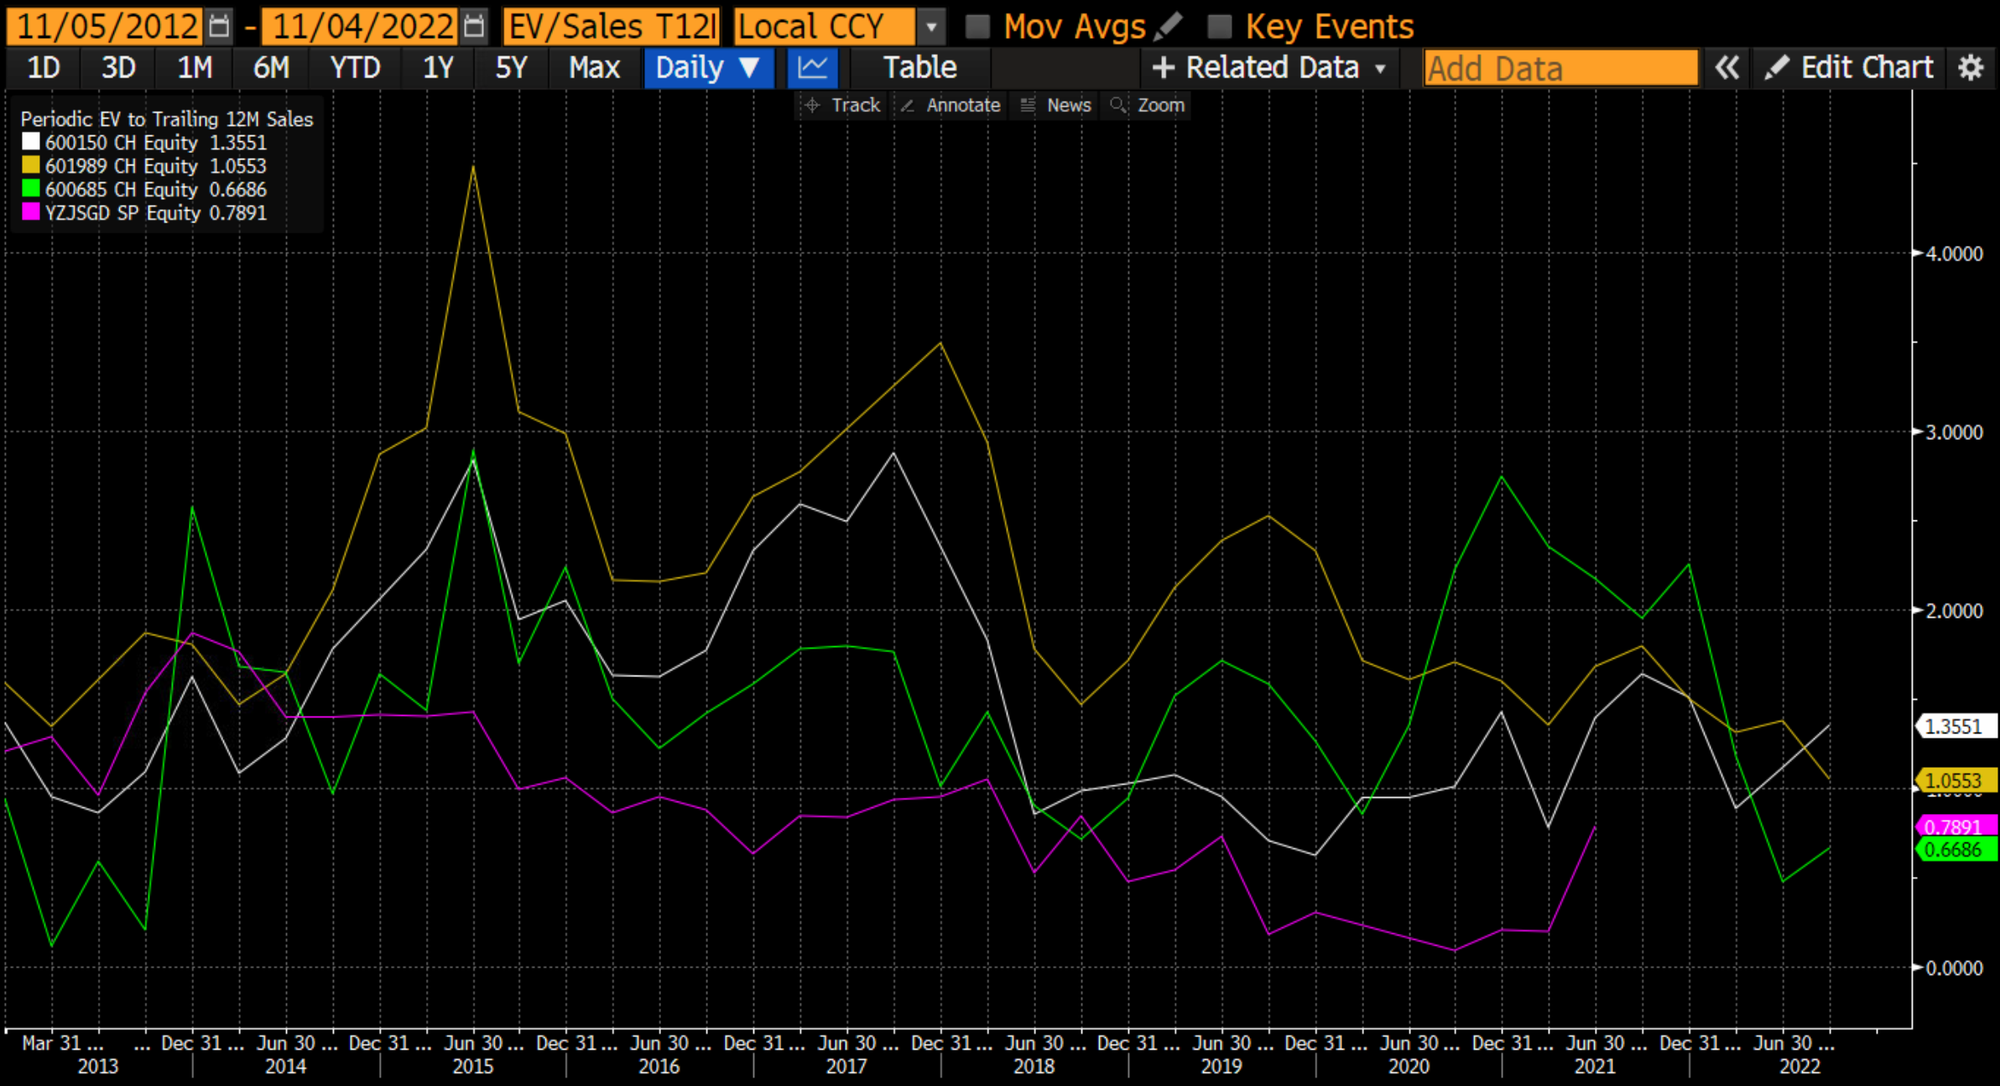
The state-owned shipyards trade at relatively high EV/sales, despite weak profitability. That may reflect the currently-high valuations in China’s A-share market. Yangzijiang - assuming that their reported numbers are correct - looks downright cheap given the strong order book and operating margins of almost 20%. But I’m sceptical about the numbers. How can a shipyard earn 20%+ margins in a commodity industry such as shipbuilding? It defies belief.
5.3. Japan
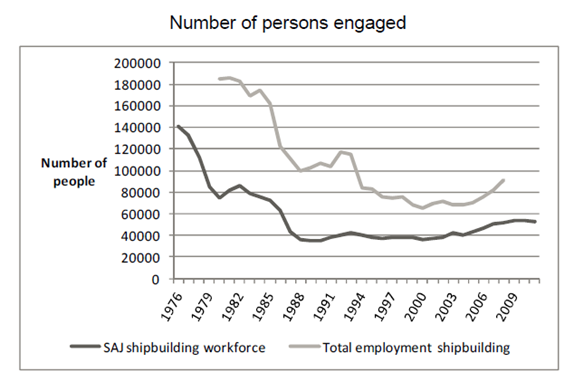
Japan’s shipbuilders have lost market share over the past few decades. Before 1999, Japan produced most of the world’s ships. But today, Japan’s global market share is in the low teens. The primary driver has been rising labour costs in Japan and the increased sophistication of Korean and Chinese shipbuilding.
There have been efforts to consolidate the industry, with Mitsui E&S now becoming absorbed into Mitsubishi Heavy Industries (defence) and Tsuneishi (commercial).
The order book of the Japanese shipbuilders comes primarily from Japanese shipping lines, such as NYK Line, Mitsubishi OSK, and the "K" Line.
The largest shipbuilder in Japan, Kawasaki Heavy Industries, is a diversified conglomerate active in the production of motorcycles, hydraulics for excavators, jet engines, aircraft and finally shipbuilding. The company started as a shipyard in 1878, but today, the shipyard business is only a small portion of the total. Kawasaki’s shipyard focuses on high-performance LNG carriers, container ships, bulk carriers, VLCCs and submarines for the Japanese Maritime Self-Defence Force. Its shipyards are at Kobe and Kagawa, and it also has a few joint ventures with COSCO in China.
Namura Shipbuilding is a large pure-play shipyard company. It produces bulk carriers, tankers and LNG/LPG carriers, mostly for domestic customers but priced in US Dollar terms. Namura’s shipyards are spread out across Sasebo and Hakodate shipyards. The near-term order book seems strong as LNG prices have spiked and the demand for tankers is on the rise as well.
Finally, Mitsui Engineering and Shipbuilding (Mitsui E&S) is a subsidiary of the trading company Mitsui. Its shipyard at Tamano is one of Japan’s largest, but it also has shipyards at Chiba, Oita, Yura and Niigata. Other than shipbuilding, Mitsui E&S also has an engineering business, constructing power plants for third parties. The company is currently being restructured, with a 49% stake sold to Tsuneishi. Meanwhile, Mitsubishi Heavy Industries will acquire Mitsui E&S’s defence business. So the ListCo “Mitsui E&S” will see its exposure to shipbuilding drop significantly.
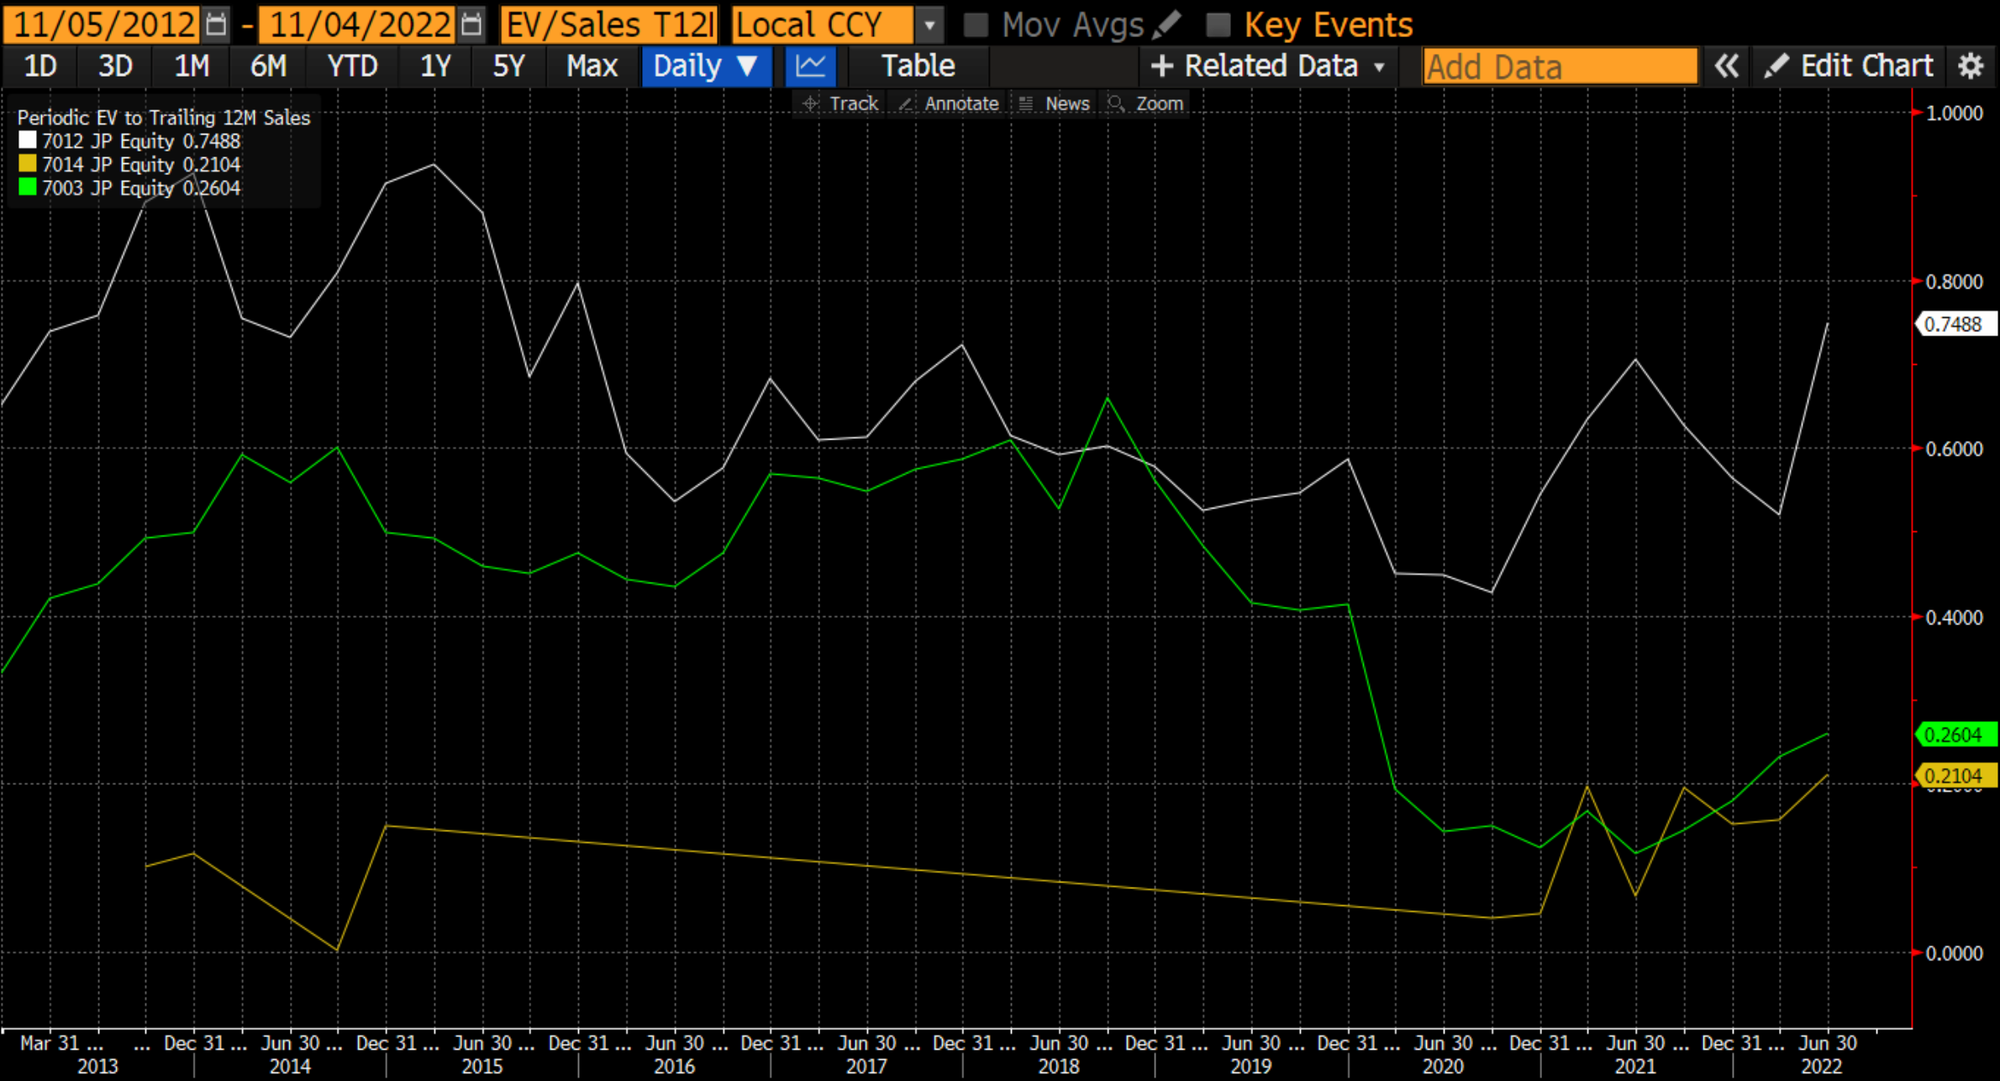
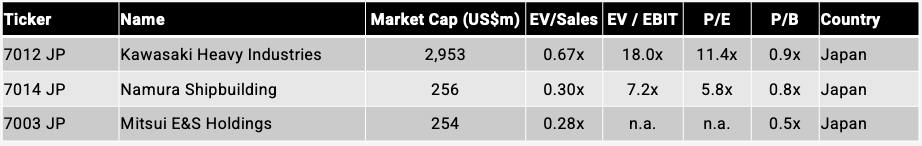
Kawasaki Heavy Industries trades at a low multiple, but note that its return on equity has been in the single digits for many years. Namura made mid-single-digit operating margins in the 2000s and double-digits during the oil bull market of 2012-14. Today’s Price/Sales of 0.38x (excluding restricted cash) still seems low given the potential for a return to full utilisation and high-single-digit margins. Before 2019, Namura traded at a Price/Sales of around 0.60x. The weakness in the Japanese yen should help. While Mitsui E&S continues to trade at a low multiple, the reorganisation will lead to a cash inflow from my understanding, and it’s not clear where this cash will end up.
5.4. India
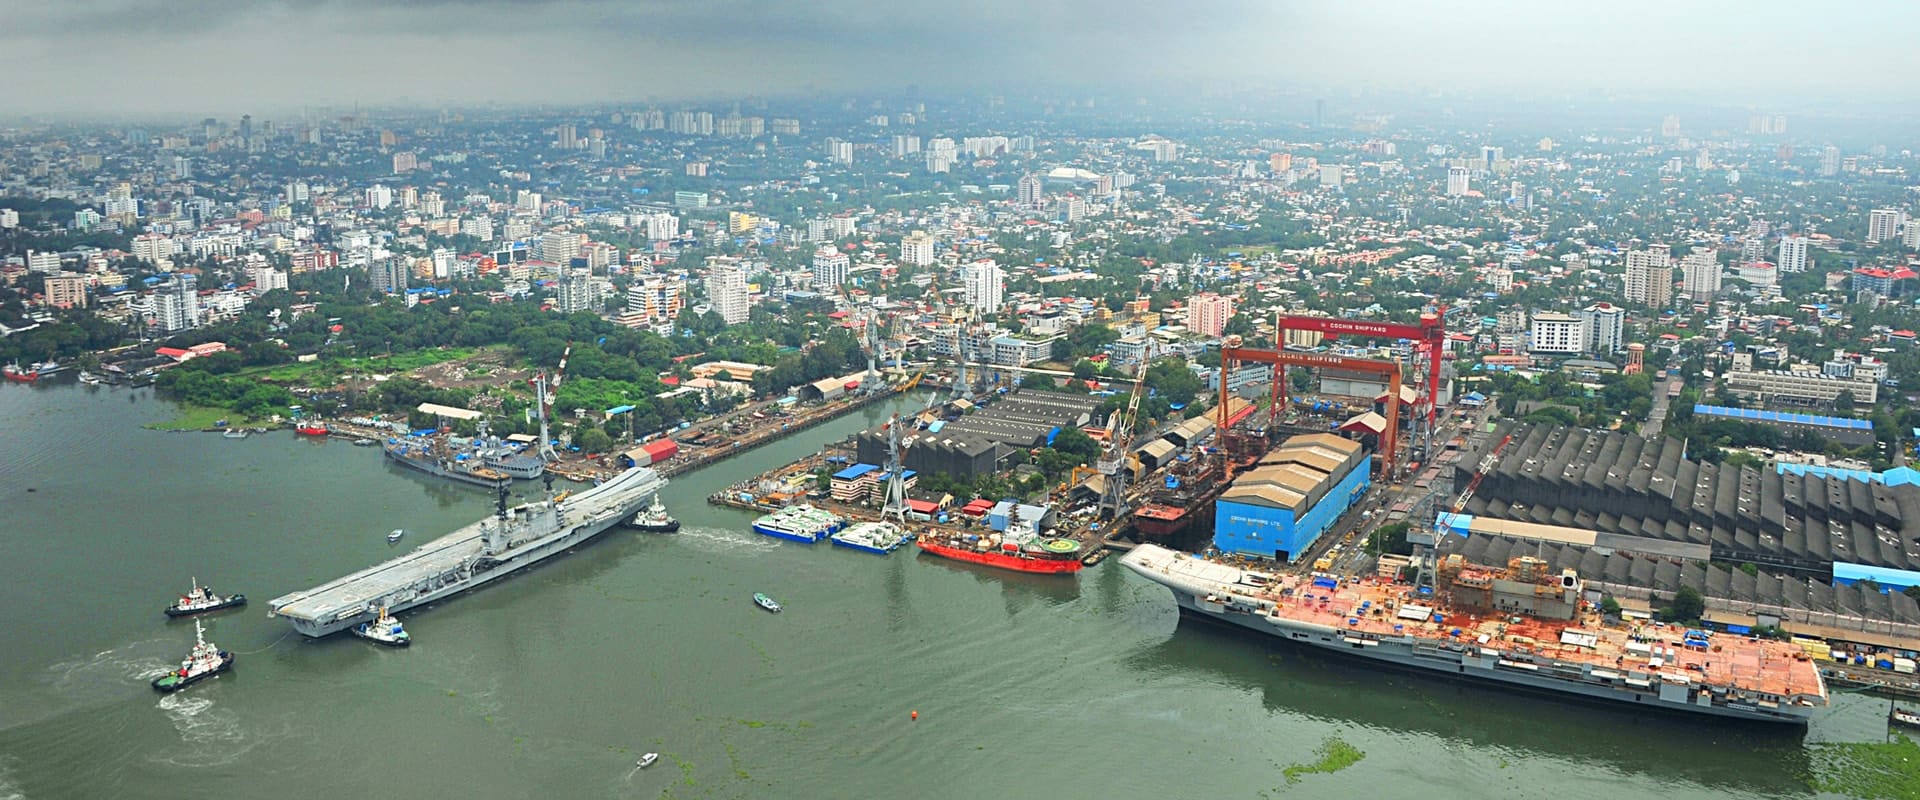
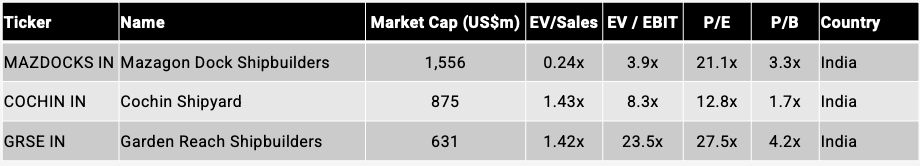
India’s listed shipbuilders are all controlled by the state and focus on defence work. Cochin Shipyard in Kerala, for example, is building India’s first indigenous air defence ship for the Indian Navy and is managed by the Ministry of Shipping. Cochin Shipyard also has a commercial business, which it developed together with Mitsubishi Heavy Industries. Mazagon Dock in Mumbai and Garden Reach Shipbuilders in Kolkata are managed by the Ministry of Defence and also have significant exposure to defence orders.
Neither Cochin Shipyard nor Garden Reach Shipbuilders are particularly cheap on their near-term valuation multiples. Mazagon Dock’s P/Sales multiple (excluding restricted cash) is 2.23x, also a very high multiple, as Indian investors are getting excited about defence stocks in a world of greater geopolitical tensions.
5.5. Other countries
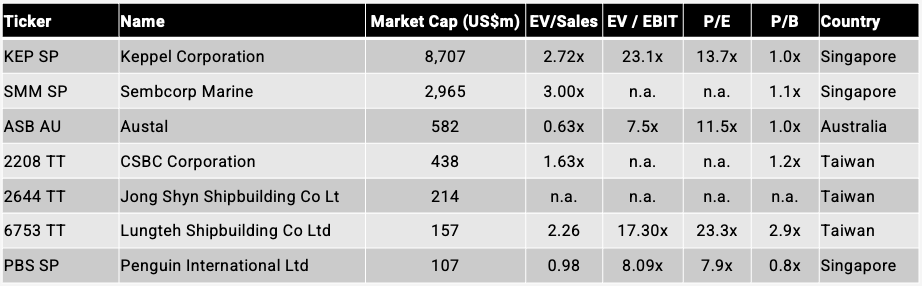
Singapore has four shipyards: Keppel shipyard: owned by Keppel Corporation, Jurong Shipyard: owned by Sembcorp Marine, ST Engineering Marine: owned by ST Engineering, and Penguin Shipyard: owned by Penguin International.
Both Keppel and Sembcorp Marine are owned by the Singapore government through the holding company Temasek (21% and 49% stakes, respectively). There have been discussions in the past of merging Keppel and Sembcorp Marine, but nothing has materialised. The shipyards are seen as cost-efficient, despite Singapore’s higher wages, as many of its workers are from overseas, including Bangladesh. Keppel’s and Sembcorp Marines’ exposures are tilted towards the construction of oil rigs, including drillships.
ST Engineering is a Singaporean defence company with limited exposure to its shipyard business. The shipyard focuses on defence orders but also produces commercial vessels such as passenger ferries and offshore support vessels for the oil & gas industry.
Penguin International is a homegrown Singaporean shipbuilder focusing on patrol boats, fire fighting, search and rescue vessels, passenger ferries and windfarm support vessels. The company is profitable and seems to be well-run.
Taiwan’s shipyard sector is dominated by the state-owned enterprise CSBC Corporation, which has shipyards in both Kaohsiung and Keelung. The company was built around a Mitsubishi Heavy Industries shipyard that was taken over by the ROC government after the second world war. Today, it produces warships, submarines and commercial ships such as containerships, mostly for Taiwanese shipping lines such as Yang Ming and Evergreen. CSBC’s civilian-defence split is about 40/60%. In Kaohsiung, you’ll also find a major private shipyard owned by Jong Shyn. Meanwhile, Lungteh’s shipyard is in Yilan and produces corvettes and other warships for the ROC Navy.
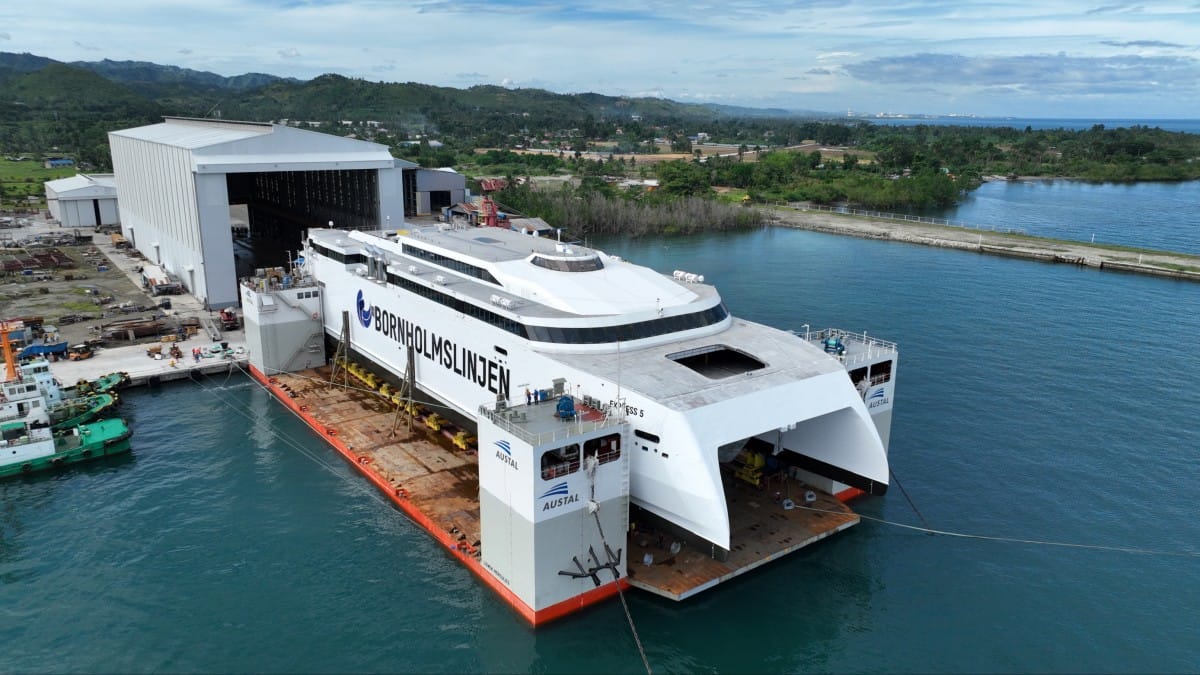
Finally, Australian shipyard operator and defence contractor Austal has shipyards across the world. Defence vessels are produced in Henderson, Australia and in Alabama. Its commercial vessels are in the Philippines. Examples of ships it has built include littoral combat ships, catamarans, patrol boats and passenger ferries.
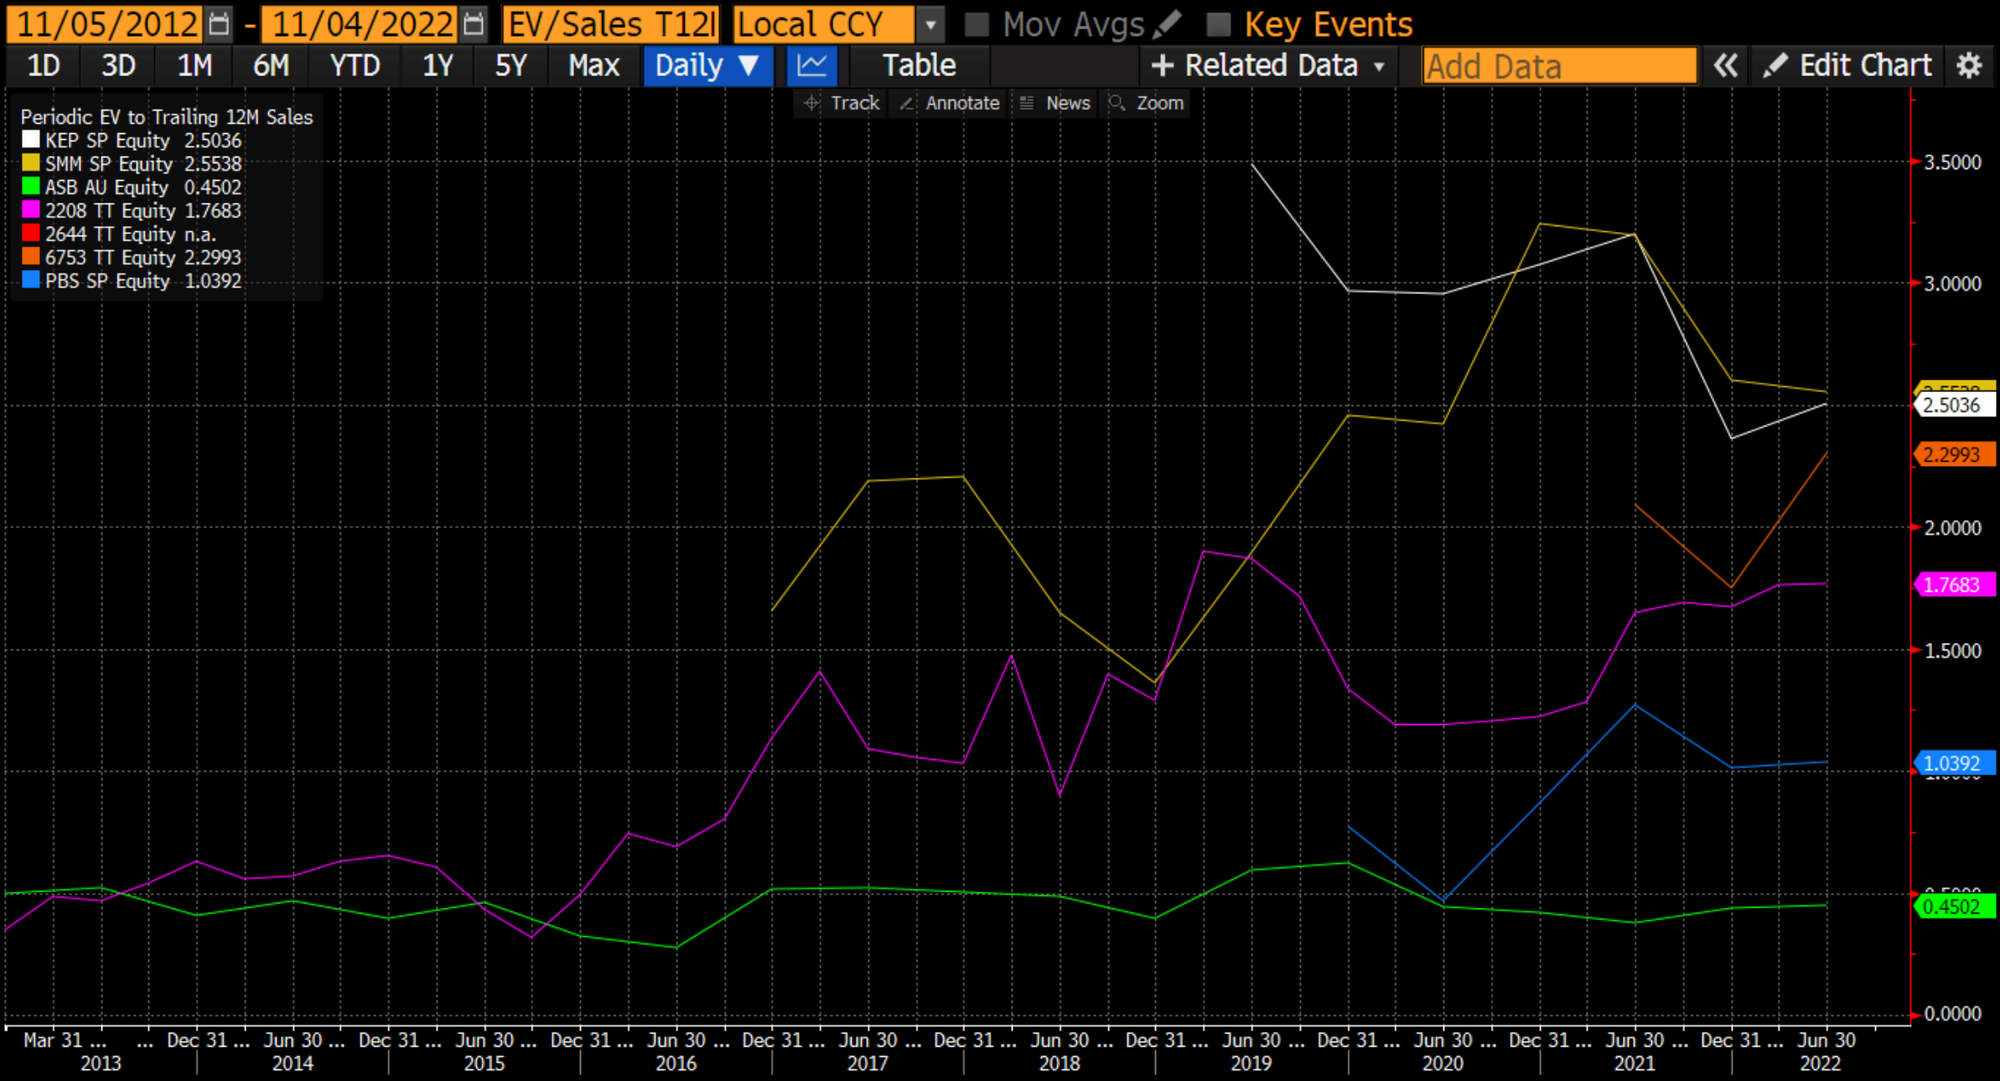
Neither Keppel Corporation nor Sembcorp Marine looks particularly cheap on their multiples. Penguin, while fully utilised, trades at the upper range of its historical trading range. The Taiwanese shipyards do not trade at low multiples either. Australia’s Austal, on the other hand, trades at only 11.5x P/E, despite an environment of ever-increasing defence spending across the globe.
6. Conclusion
The shipyard industry is competitive, and margins have been dropping, perhaps because of competition from Chinese yards that receive significant state support.
There’s been a significant increase in orders for containerships and LNG carriers, and those will keep tier 1 yards busy for the next few years. Meanwhile, the weak profitability of 2021 vintage orders will slowly disappear from backlogs, causing shipyard profitability to improve.
That said, a Price/Sales of 1.0x for the Korean shipyards seems excessive in my mind unless they can dramatically increase revenues further. The state-owned Chinese shipyards are not profitable, and Yangzijiang looks attractive on the numbers, although the numbers seem almost too good to be true. Namura Shipbuilding in Japan, on the other hand, trades at a Price/Sales of just 0.38x, below its historical trading range. It should benefit from the weaker yen and an uptick in orders for tankers and LNG carriers.
I’m personally interested in defence contractors, as I see secular growth in defence spending across the globe. Shipyards serving the defence industry include Austal and Japan’s Kawasaki Heavy Industries.