Mapping the Asian ETF market
The ins and outs of Asian ETFs. Estimated reading time: 21 minutes
Disclaimer: Asian Century Stocks uses information sources believed to be reliable, but their accuracy cannot be guaranteed. The information contained in this publication is not intended to constitute individual investment advice and is not designed to meet your personal financial situation. The opinions expressed in such publications are those of the publisher and are subject to change without notice. You are advised to discuss your investment options with your financial advisers. Consult your financial adviser to understand whether any investment is suitable for your specific needs. I may, from time to time, have positions in the securities covered in the articles on this website. This is not a recommendation to buy or sell ETFs.
I’ve received many questions from family & friends about exchange-traded funds (ETFs). Some want to build exposure to Asian equities without owning individual stocks. And others are restricted by their employers from investing directly in stocks.
So here is a short introduction to the asset class and the options available for those who want exposure to Asian equities via ETFs.
Summary
ETFs help you build diversified exposure to equities.
Crowding into ETFs can cause their constituents to become overvalued and provide poor prospective returns. That can be true of any ETF, but especially thematic ETFs focused on hot sectors such as cannabis or robotics.
Two funds that provide low-cost and well-diversified exposure to Asian equities are Vanguard Total International Stock ETF (VXUS US) and Next Funds TOPIX (1306 JP). For more specific exposure, a few options are VanEck Morningstar International Moat ETF (MOTI US), the iShares MSCI China Small-Cap ETF (ECNS US) and the Global X MSCI Pakistan ETF (PAK US).
1. Introduction to ETFs
Exchange-traded funds (“ETFs”) are investment funds traded on stock exchanges. Most of them are open-ended, meaning that they are open for subscriptions and redemptions continuously. ETFs can hold stocks, bonds, currencies, commodities or derivatives contracts.
The key difference between mutual funds and ETFs is that you buy mutual funds directly from the fund management company. ETFs, on the other hand, are purchased from other investors. That causes the ETF price to fluctuate based on supply & demand for it. To make sure that the price remains tethered to the value of the underlying assets, market makers (“authorised participants”) are able to exchange ETFs into the baskets with the underlying securities. If the ETF price diverges too much from underlying stock prices, the market makers earn risk-less profits and in the process, the ETF price will adjust back to its correct level.
The first ETF was created in the United States in 1989. They remained niche until 1993 when Standard & Poor’s launched their popular S&P Depositary Receipts ("SPDR”, or “Spiders”).
Today, the ETF industry has about US$10 trillion in assets under management (“AUM”) and continues to grow. For reference, the total world stock market capitalisation of approximately US$90 trillion.
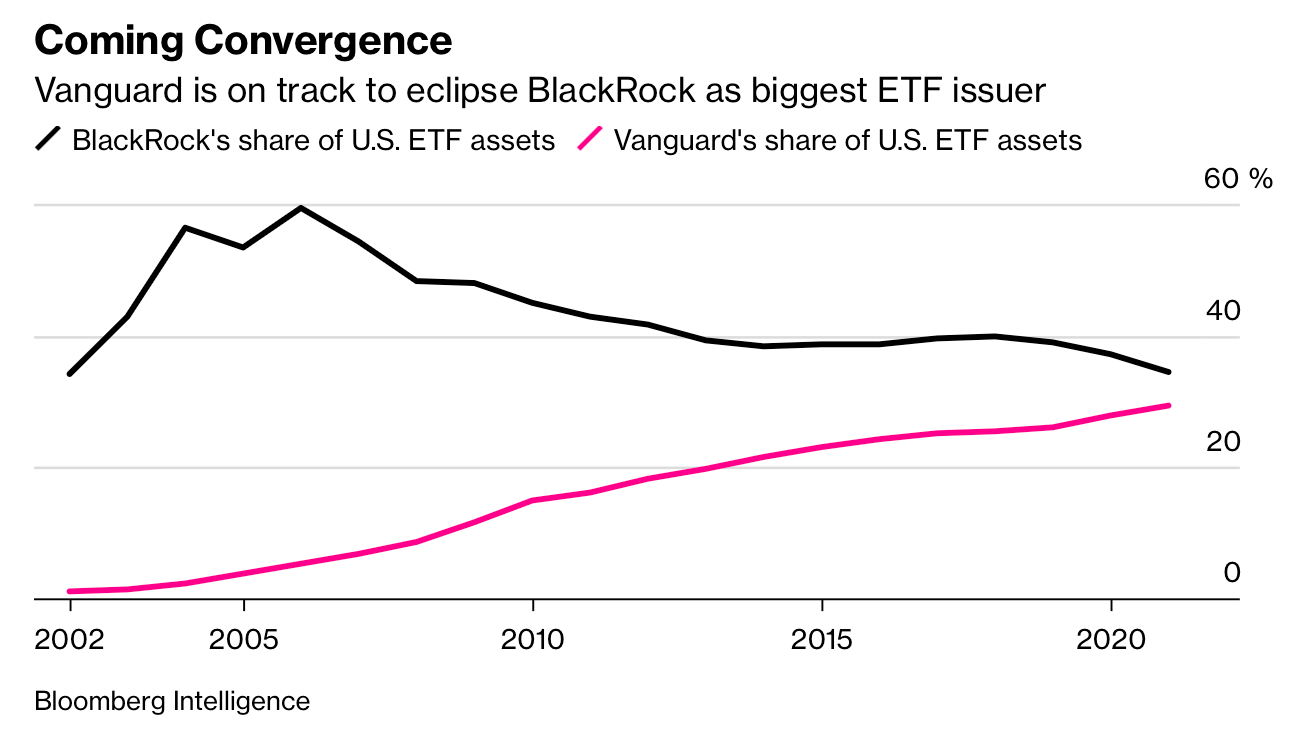
Thanks to economies of scale, the largest funds can keep their cost per dollar of AUM low. That allows them to keep their expense ratios low and attract further AUM. That’s how the ETF market ended up being dominated by just 3-4 major institutions, including Blackrock and Vanguard.
Vanguard is increasingly becoming the industry leader. The company is owned by its funds, enabling it to avoid conflicts of interest and keep its expense ratios low. To give you a sense of how much cheaper Vanguard funds are, they have a 30% market share in the United States but only represent 5% of industry revenues.
Passive ETFs invest their capital along the lines of set investment criteria. Most passive ETFs track specific benchmark indices such as the S&P 500. Active ETFs are managed by investment professionals.
The ETF options that are available to investors include:
Passive ETFs: The vast majority of ETFs are passive index funds that replicate the performance of specific indices. The indices that these passive funds track typically set the benchmark weights in line with companies’ relative market capitalisations and may also adjust for the percentage of shares that are freely tradable. Equal weighted ETFs are rare but popular among some investors. The benchmark weights might also be set based on certain factors such as growth, value, dividend yield, etc. (so-called “factor ETFs”). Passive funds now represent >40% of (active + passive) equity AUM in the United States.
Active ETFs: A small share of total ETFs have active management components. They tend to charge higher fees. Some active ETFs disclose their portfolios daily, and some do not. Timely disclosure helps reduce bid-offer spreads since market makers can hedge out their exposures. On the other hand, when active managers such as Cathie Wood disclose their entire portfolios daily, they risk being front-run by other nimble investors when they try to build up or sell a position.
Commodity ETFs: Some ETFs give you a direct interest in a commodities portfolio. Examples of such ETFs are the SPDR Gold Shares, whose shares give you direct ownership of 1/10 of an ounce of gold. Other examples include iShares Silver Trust and the Aberdeen Standard Physical Platinum Shares ETF.
Futures-based ETFs: Some commodity ETFs invest in near-term commodity futures contracts. While such funds provide exposure to commodity prices, near-term contracts tend to be expensive, and they need to be rolled over every month at high costs. But for perishable commodities such as grains or commodities with high storage costs such as coal, you’ll have no other choice than a futures-based ETF. The ETFs used to speculate on the Chicago Board Options Exchange's CBOE Volatility Index (VIX) also invest in futures.
Currency ETFs: Currency ETFs give investors exposure to a single currency or a basket of currencies. You’ll gain from both exchange rate movements and interest income from the currencies you invest in.
2. Index funds tend to outperform
Over the past few decades, most active managers have underperformed their benchmark indices. And they’ve also underperformed their passive index ETF peers since those tend to track the same benchmark closely.
A recent Morningstar study found that only 26% of all active funds managed to beat their passive peers over the ten years ending 2021. In emerging markets, 54% of active managers managed to beat their passive peers, making the active/passive choice more or less of a coin toss for those markets.
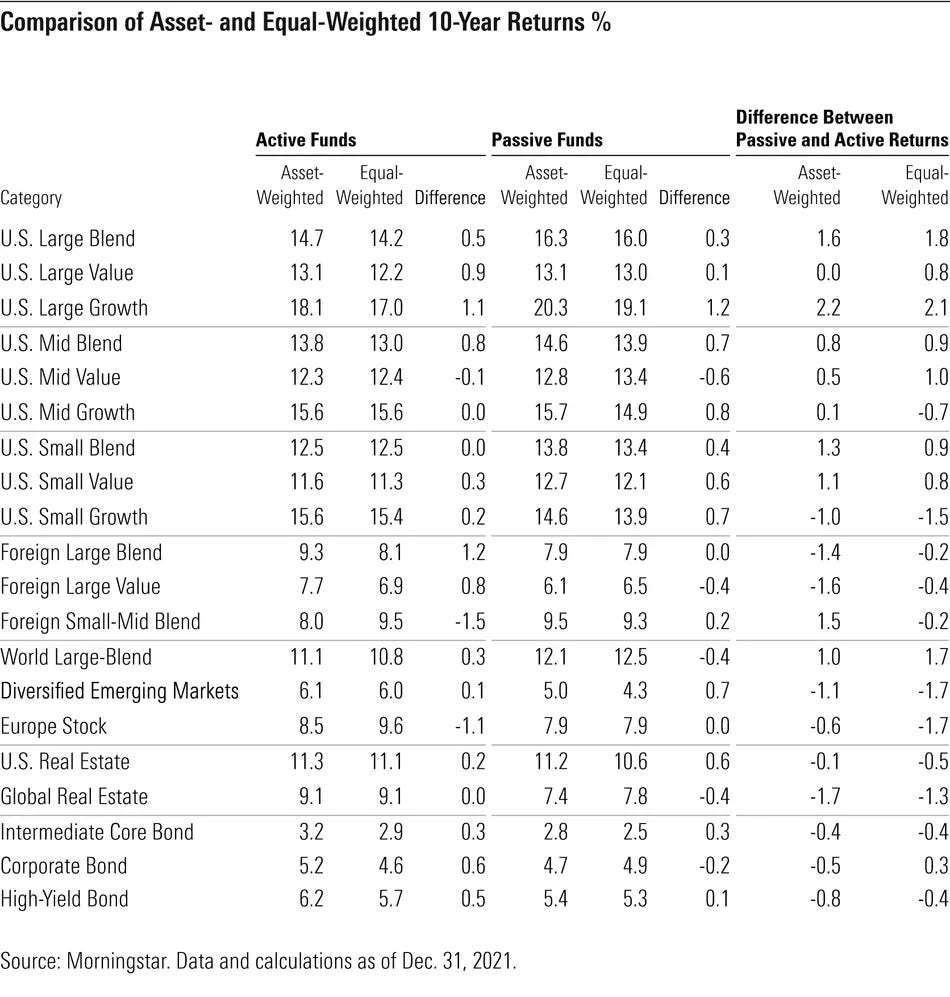
A large portion of the underperformance seems to be related to active funds’ higher fees. The higher the fees, the greater the likelihood of underperformance.
So, as a rule, passive funds tend to outperform their active counterparts. But in specific emerging markets where passive funds are costly and poorly constructed, active funds may still be worth considering.
3. Passive funds enable low-cost stock exposure
The main reason why you’ll want to purchase ETFs is that they charge less than their mutual fund counterparts.
ETFs also provide tax benefits for investors in high-tax jurisdictions:
Because of how the creation/redemption mechanism for ETFs works, there is no need to interact with the issuer. You simply buy the ETF from a seller on the secondary market. That means that ETFs do not have to distribute capital gains to their shareholders and that owners of ETFs also do not have to pay tax on such capital gains.
There’s also potential for tax-loss harvesting. The more ETFs you invest in, the easier it will be to sell loss-making positions to counteract profits made through other ETFs. Since the transaction costs are low and there are many ETF options to choose from, active trading for tax-loss harvesting purposes might not increase the overall risk of your portfolio. For example, you can simply exchange one S&P 500 index fund for another.
In the United States, the total expense ratio for an ETF can be as low as 0.05%. In Asia, ETFs typically cost around 0.50% per year. That’s still lower than the 1%+ that Asia-focused mutual funds tend to charge.
The total expense ratios typically quoted by ETFs include:
The management fee: The fee that the fund company charges annually to manage the fund (typically commission paid to fund managers)
Other charges: share registration fees, fees payable to auditors, legal fees, and custodian fees.
There are also hidden costs of owning an ETF. The total expense ratio excludes the trading commission. It also excludes frictional costs from wide bid-ask spreads when buying the ETF. Such spreads are particularly wide during times of volatility and when the composition basket is not disclosed publicly. What’s worse, many investors in ETFs buy them using “market orders” instead of “limit orders”, increasing the risk that they’ll buy the ETF at expensive levels.
Counteracting the negative effect of fees, ETFs often lend their securities to other investors, helping them capture additional income for the owners of the fund.
The best way to understand the total costs of owning an ETF is to compare its net asset value (“NAV”) with the benchmark index over time. Then compute a multi-year compound annual growth rate for the NAV vs the benchmark to see how well the ETF performs for investors in a real-life scenario.
4. Diversification vs concentration
Except for the question about fees, the most important factor to pay attention to is the selection of stocks the ETF actually invests in.
Most Asian ETFs track value-weighted benchmarks, which means that any new money is invested relative to the market caps of the companies in the index. Value-weighted benchmarks tend to be float-adjusted, which means that the allocation towards each stock depends on what proportion of each company’s shares are freely tradable.
Are value-weighted ETFs better than others? Research shows that flows into index funds disproportionately raise the prices of large stocks more than small stocks. That means that if you’re a late buyer of value-weighted index ETFs, you will buy a portfolio of stocks that are more expensive than the overall market. As economist Charles Gave noted:
“Buying a market capitalization-weighted index like the S&P 500 is really a systematic way of doing momentum buying; the higher the market cap, the more the passive investor should buy.”
An alternative way of constructing benchmark indices is putting an equal percentage into each stock - an “equal-weighted index”. In theory, equal-weighted indices provide greater diversification and greater exposure to small stocks. They tend to outperform their value-weighted peers over the long run:

There are three caveats to the outperformance of equal-weighted ETFs:
In speculative environments such as the Dotcom boom, retail investors are attracted to large-cap brand name stocks such as Tesla. In such an environment, value-weighted indices are likely to outperform.
Value-weighted stocks tend to do better when breadth starts to deteriorate, typically towards the end of each market cycle. The Dotcom bubble was an exception.
Since the benchmark index maintains equal weights, funds will continuously sell stocks that do well and buy stocks that have dropped. As Peter Lynch has warned, selling your winners and holding your losers is like “cutting the flowers and watering the weeds”. Intuitively, this does not seem like a winning strategy.
So ultimately, while I do think that equal-weighted ETFs may be better over the long run, I’m also comfortable with value-weighted indices that have decent exposure to small caps or stocks that haven’t yet become popular with the rest of the investor community. Just try to avoid crowding into stocks that are popular with the broader investor community.
While most ETFs invest 100% of their assets in the underlying benchmark securities (a practice called “replication”), some use derivatives to build their benchmark exposure. The use of derivatives (“representative sampling”) gives rise to counter-party risk and the potential for tracking errors during times of high volatility. You’ll have to read the fund documents to understand how much of the portfolio comprises underlying benchmark securities and how much of the exposure is synthetic.
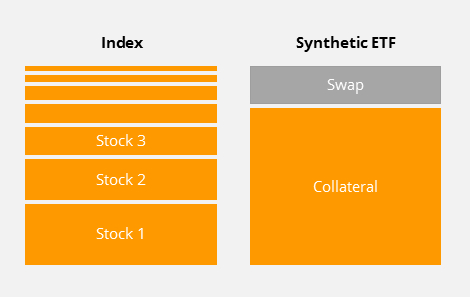
In Asia, representative sampling is common - especially in markets with foreign ownership restrictions. But in my studies, I’ve found that even frontier market ETFs usually do not lag their benchmark index by more than 1% per year. Check the fund documents to see whether the ETF can use derivatives to replace exposure to the actual benchmark securities.
Be aware that some index providers may have interests that are opposed to yours. In his book “Trillions”, author Robin Wigglesworth reported that the Chinese government launched a campaign against MSCI - which included threats against its local business - to get its stock market included in the MSCI Emerging Markets Index. I happen to think a greater proportion of Chinese equities in MSCI indices was warranted. But at the same time, this episode shows that index providers can face significant political pressure. So don’t expect the index constituents to be selected randomly.
The best way to understand whether a benchmark is diversified or not is to look at what percentage the top 10 stocks represent of the total portfolio. You can also look at the sector and country allocation and compare their contribution to benchmark earnings or country GDP.
5. Thematic ETFs can be dangerous
“Thematic ETFs” are exchange-traded funds that focus on specific sub-sectors such as cannabis, robotics or ESG. I have three problems with such funds:
They charge significantly higher fees.
Investors tend to speculate in such ETFs in a momentum fashion.
They don’t always invest in the type of stocks that they claim to invest in
By the end of 2021, there were ~2,000 thematic funds globally, representing 2.7% of equity fund assets globally - up from just 0.8% a decade earlier.
The most popular themes include the Internet, robotics, environment, digital assets, cannabis and EVs. Thematic funds tend to sell stories that capture the imagination of investors - representing what economist Bob Shiller would call “new era thinking”.
A famous example is ARK Innovation ETF, managed by Cathie Wood’s ARK Invest. Other examples include the passive Global X Cloud Computing ETF and the Global X Robotics and Artificial Intelligence ETF.
While fees have come down over time, they continue to charge significantly more than their passive index ETF rivals:
Investors often trade thematic ETFs in a momentum fashion. Retail investors tend to get excited about particular themes in the hope of near-term gains. If and when their investment fails to produce the desired gains, they’ll often sell them in a panic.
In his book Soros on Soros, speculator George Soros described the key stages of a typical “boom-bust” process: a stock going from being undiscovered to becoming the object of speculation and finally crashing. In any speculative episode, he believes that one should separate 1) the underlying trend and 2) the perception of that trend. His key point is that perception can affect the underlying trend in a reflexive feedback loop.
Soros used the example of acquisitive REITs in the 1960s to illustrate how boom-bust processes work. At the time, investors were obsessed with top-line growth, which was driven by acquisitions. When investors started bidding up REIT prices, that enabled the REITs to use their higher-priced stocks as acquisition currency, make even more acquisitions and thus speed up growth. It led to a virtuous cycle of ever-higher prices. Eventually, REIT prices reached unsustainable levels, and the process went into reverse.
I’m bringing this up because thematic ETFs often go through similar boom-bust processes. Whenever a new trend catches the imagination of investors, flows into related thematic ETFs cause them to outperform temporarily. Investors are then led to believe that their outperformance is proof that the “new era thinking” has validity, leading to further inflows.
Eventually, new thematic AI / robotics / ESG / cannabis funds are launched to satisfy the public’s demand for the theme, buying up available shares at high prices.
A study from the Swiss Finance Institute’s white paper Competition for Attention in the ETF Space showed that the negative alpha from thematic ETFs has been about -6% per year in the first five years, even after adjusting for value, size, volatility and momentum.
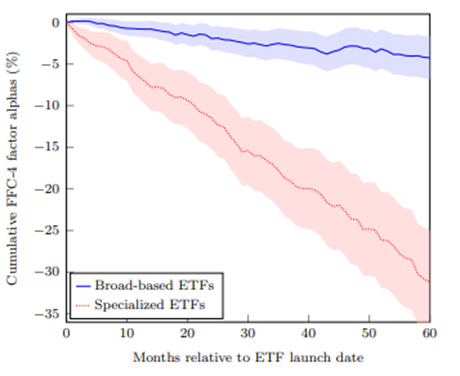
As the authors conclude:
“Our results suggest that specialized ETFs fail to create value for investors. These ETFs tend to hold attention-grabbing and overvalued stocks and therefore underperform significantly: They deliver a negative alpha of about −3% a year. This underperformance is stronger right after launch, at about -6%, and persists for at least five years after their inception.”
Another Morningstar study showed that the Sharpe ratio for thematic funds has been roughly 0.56x over the long run, vs 0.96x compared to Morningstar’s chosen index benchmark (the Morningstar US Market Index).
And it gets worse. The same Morningstar study shows that actual investor returns in those same thematic funds lagged their reported fund returns by an additional 4% per year because they timed their purchases poorly.
So while thematic ETFs do offer a low-cost alternative to professional money management, the ETF constituents are often overvalued, low-quality companies that tend to underperform over the long run. And the way investors typically trade thematic ETFs cause them to underperform further.
6. Picking Asian ETFs
To avoid the problems I have described above, I think it makes sense to avoid thematic ETFs and instead invest in highly diversified alternatives and own them for the very long run.
Here are a few criteria that I think you can pay attention to when selecting an ETF:
Low cost: tight correlation between NAV and the benchmark
Value: multiples such as P/E and dividend yield
Diversification: number of stocks in the fund, including small-caps
Replication: ownership of actual shares, not swaps
Liquidity: a high daily US$ trading volume
Un-levered: no leverage
Minority protection: Investing in countries with a secure rule of law
If you must buy a concentrated index, make sure that the index constituents offer value and that you’re willing to hold the ETF through any volatility.
Here is a non-exhaustive but comprehensive list of 50 popular Asia-focused ETFs:
If you want to allocate capital within Asia according to GDP weight, close to 50% of the capital should be invested in Chinese equities, 17% in Japan, 10% in India and 5% in South Korea. If you want to allocate according to relative population numbers, then the weight towards Indian equities should be higher than the GDP numbers suggest. I personally invest disproportionately in democratic countries since stocks in such countries tend to outperform.

In Asia, popular ETF benchmark indices include TOPIX, Nikkei 225, KOSPI 200, MSCI Asia Ex-Japan, MSCI China, FTSE Developed Asia Pacific Index, MSCI India and MSCI Korea 25/50 Index.
I’ve found that many country-focused ETFs have excessive exposure to individual stocks. For example, most Hong Kong-focused ETFs have excessive exposure to AIA, most Taiwanese ETFs have excessive exposure to TSMC, etc. If you invest in country ETFs, ensure that the entire collection of ETFs in your portfolio offers diversification in the aggregate.
But even regional indices can be distorted. MSCI Asia Ex-Japan, for example, has excessive exposure to technology stocks. The current exposure to technology is most likely excessive compared to the historical average or even the aggregate index earnings split.
After going through the above list of ETFs, I have narrowed down the list to five ETFs that I believe stand out.
6.1. Vanguard Total Int’l Stock ETF (VXUS US)
The Vanguard Total International Stock ETF is a broadly diversified index of stocks outside the United States. The benefit of VXUS is that the expense ratio is only 0.07%. Historically, the NAV has tracked the benchmark closely - off by only 0.08% per year.
The VXUS ETF gives you broad non-US equity exposure. Today, many investors have significant exposure to US equities, whereas the United States only represents 16% of global GDP. In my view, a properly diversified portfolio should have a greater than 50% exposure to non-US equities.
The ETFs diversification is excellent: it contains 7,824 stocks across various sectors, with only 12.5% exposure to technology stocks. The exposure to financials is somewhat high at 19.1%. While the usual suspects of TSMC, Tencent and Alibaba are in the top 10, they represent minuscule parts of total AUM. Japan represents 15% of the index, China 9%, Taiwan 5% and India 4%.
While VXUS is a value-weighted index, it is so diversified that the median stock is likely to be a small-cap rather than the typical mega-cap in most Asian MSCI indices.
6.2. Next Funds TOPIX (1306 JP)
The Japanese index ETF that offers the most-diversified exposure to Japanese equities is the Next Funds TOPIX ETF. TOPIX is more diversified than the Nikkei 225/400 indices. The ETF contains 2,174 stocks, and the largest constituent, Toyota, is only 4% of the portfolio.
The Japanese Yen has dropped significantly over the past month due to dovish announcements from the Bank of Japan and weaker terms of trade due to rising commodity prices. But Japan is an export machine, and many of its companies should see their revenues benefit from a weaker yen.
The ETFs aggregate P/E ratio of 13.4x and dividend yield of 2.31% is in line with the average for ex-US stocks.
The ETF has an expense ratio of just 0.09% and tracks the benchmark index closely. Over the past five years, it has only lagged the index by 0.09% per year - an excellent result.
6.3. VanEck Morningstar Int’l Moat ETF (MOTI US)
The VanEck Morningstar International Moat ETF replicates the performance of the Morningstar Global ex-US Moat Focus Index. The benchmark provides equal-weighted exposure to the top 50 wide- and narrow-moat stocks with the lowest [price/fair value] ratio, which is determined by Morningstar’s research team.
The stocks in the portfolio are eclectic: they include the Italian defence company Leonardo, luggage producer Samsonite, Korean telecom company KT Corp and British American Tobacco. It’s the type of portfolio that I would be comfortable owning.
MOTI’s expense ratio is 0.56%. Up to 20% of the benchmark index exposure may be replicated through derivates - a number that I wish would be lower. Then again, MOTI’s performance has only lagged the benchmark index by 0.7% per year.
The fund’s market cap is small at only US$67 million. The average trading volume has been a bit above US0.5 million per day.
6.4. iShares MSCI China Small-Cap ETF (ECNS US)
For those who want exposure to Chinese equities, one option might be the iShares MSCI China Small-Cap ETF fund, which tracks the MSCI China Small Cap index.
It’s a well-diversified index with 280 holdings with decent sector diversification. The largest holdings are JinkoSolar, China Conch, Xtep, Inner Mongolia Yitai Coal and Zhaojin Mining. No position is larger than 2.3% of the total portfolio. It has the benefit of being value-weighted and focused on small caps, which tend to outperform large caps. ECNS is one of few China-focused indices whose largest positions aren’t Alibaba, Tencent and Meituan.
My recent interest in Chinese equities has been sparked by the fact that credit growth has accelerated in the first three months of 2022. While Omicron-induced lockdowns are hurting economic growth, it is plausible that by early 2023, China’s zero-COVID policy have been relaxed. By then, higher credit growth should also start having a positive impact on the country’s fixed-asset investment.
ECNS’s P/E ratio is 11.4x, and the dividend yield is 3.8%. The total expense ratio is 0.59%. It has outperformed its benchmark by almost 2% per year, which is somewhat worrying but could be due to securities lending.
The fund’s AUM is US64 million and daily liquidity of US$0.5 million per day.
6.5. Global X MSCI Pakistan ETF (PAK US)
The Global X MSCI Pakistan ETF tracks the MSCI All Pakistan Select 25/50 Index. In US Dollar terms, Pakistani stocks were down about 50% from their peak in 2017.
It has 31 stocks in the portfolio, with a P/E of 4.2x and a dividend yield of 8.5%. Stocks in the portfolio include Lucky Cement, Engro Corporation, Hub Power, Habib Bank and United Bank. The draw here is how cheap Pakistani stocks are and how difficult it is to get exposure to them through most retail brokers.
PAK’s diversification isn’t great, with almost 60% of the portfolio in its top 10 positions. Still, the Pakistani stock market is small and should be judged in the context of a larger portfolio.
PAK’s expense ratio of 0.76% is acceptable. It has lagged the benchmark by roughly 1.3% per year, so owning the ETF has certain costs. It could be due to the front-running of orders given the time zone differences between NYSE and Pakistani exchanges. But in any case, 1.3% is not a high cost for a frontier market fund.
The fund is small, with an AUM of US20 million. Daily liquidity of US$90,000 is minimal but could be acceptable for smaller investors. Pakistan is a frontier market with high external debt to GDP, so be aware of the risks before investing.
7. Conclusion
I want to emphasise that none of the discussions above should be taken as investment advice, and you should consult your financial adviser before buying an ETF.
In any case, ETFs are perfect for building up well-diversified exposure to equities in the region. Vanguard has several funds that offer international (non-US) exposure in diversified portfolios.
I’m sceptical about the way retail investors trade thematic funds. They often buy overvalued popular equities at the top of a cycle. I’m also wary of futures-based commodity ETFs.
Two funds that give low-cost, well-diversified exposure to Asian equities are Vanguard Total International Stock ETF (VXUS US) and Next Funds TOPIX (1306 JP). For more specific exposures, three options could include VanEck Morningstar International Moat ETF (MOTI US), the iShares MSCI China Small-Cap ETF (ECNS US) and the Global X MSCI Pakistan ETF (PAK US).
Thanks for reading!
Sign up for over 20 deep-dive reports on Asian stocks per year, full disclosure of my personal portfolio and full disclosure of my personal Asia-focused portfolio.







I know it's such a small aspect, but those section break line images are so clean
Thank you for an interesting piece. Any thoughts on etfs focused on India? There are several and this economy will at some point pull together. As such it would be good to have a place now rather than later. In that respect, the Indian economy is considerably larger than that of Pakistan and am not sure why you would focus on it but the fund itself might be better managed. Thanks again.