Disclaimer: Asian Century Stocks uses information sources believed to be reliable, but their accuracy cannot be guaranteed. The information contained in this publication is not intended to constitute individual investment advice and is not designed to meet your personal financial situation. The opinions expressed in such publications are those of the publisher and are subject to change without notice. You are advised to discuss your investment options with your financial advisers. Consult your financial adviser to understand whether any investment is suitable for your specific needs. I may, from time to time, have positions in the securities covered in the articles on this website. This is not a recommendation to buy or sell stocks.
Summary
Value investors love cement stocks since they enjoy local monopolies. The high weight-to-value ratio of cement makes cement expensive to transport, limiting the competition within a particular area.
Since cement plants run 24/7 and incur high fixed costs, the industry can be cyclical - especially in emerging markets where capacity is added regularly.
Cement consumption volumes are low in India, Indonesia and the Philippines. But they are incredibly high in China.
Both Indonesia and the Philippines are experiencing supply/demand imbalances for cement, but the imbalances are likely to improve over time.
Table of contents
1. A short history of cement production
2. Cement companies have moats
3. How to assess value in the industry
4. Recent trends
5. Country-by-country comparisons
6. International cement markets
7. Southeast Asian cement markets
7.1. Malaysia
7.2. Thailand
7.3. Indonesia
7.4. The Philippines
8. Conclusion
1. Introduction to the cement industry
Cement is a heavy building material. It is most often used to produce concrete - a durable and inexpensive building block used to construct property and infrastructure.
It was the Roman Empire that popularised the use of concrete. Many Roman concrete structures still stand to this day - a testament to concrete’s strength and durability. But it wasn’t until the 19th and 20th centuries that demand took off globally.
Commonly used “Portland cement” was invented in 1824 by burning finely ground chalk and clay until the carbon dioxide was removed. It improved strength and durability further.
Here is a short introduction to the production of cement for those who are interested:
Quarrying of raw materials. Limestone, marl and clay are mined in quarries. Quarries are typically close to related cement plants.
Crushing and grinding raw materials. Raw materials from the quarries are then crushed and ground into 10cm pieces and mixed with other minerals into a so-called “raw meal” of input materials.
Calcination. Limestone (calcium carbonate) is turned into lime (calcium oxide) through a combustion chamber called the “precalciner”. This step generates 60% of total cement plant CO2 emissions.
Clinker production in a rotary kiln. The mix is conveyed into a kiln with ~1,450 degrees Celsius temperatures, where it is transformed into small modules called clinker. Today, most kilns are dry since they enjoy lower fuel and capital costs with shorter rotary kilns than wet kilns.
Grinding. Clinker is ground with 4-5% gypsum and other supplementary cementitious materials (SCMs) to become a fine powder cement. The use of different SCMs can affect the setting time of the cement.
Cooling, storing and packaging. The hot clinker is cooled using large quantities of air. The final product is then homogenised and stored in cement silos. It’s finally packaged into bags and transported to the end customer.
This video shows you how production takes place in real life, using Indocement’s Plant 14 as an example.
There are two popular types of cement:
Ordinary Portland cement (OPC): Faster setting time. It’s easy to handle, thanks to a high degree of fineness. It is used for slabs, beams and columns in high-rise buildings, roads, bridges, etc.
Portland Pozzolana Cement (PPC): Slightly cheaper and enjoys lower CO2 emissions. Stronger & more durable with higher workability. It’s also less porous and therefore used for mass construction projects. Use cases of PPC include residential property, marine works, mass concrete works, e.g. dams, huge foundations.
Most Ordinary Portland Cement manufacturers are shifting to Portland Pozzolana Cement due to added strength and environmental reasons.
For Ordinary Portland Cement, the critical ingredients are limestone, silica and alumina. Portland Pozzolana adds aluminosilicate.
As already mentioned, cement is used as a binder concrete (used in building foundations) but can also be used for mortars (used as glue to hold bricks together). Before cement can become concrete, “aggregates” such as sand, rocks, gravel, and water are added. The reason sand and rocks are added is that such aggregates cost very little and add strength and volume. In the final mix, there’s typically only 10-15% actual cement in the mix.
You can purchase ready-mix concrete in bags that combine cement, sand and gravel where all you need to do is add water. You can also buy bags of cement and mix them with sand and gravel yourself. Such bags of cement are transported from the cement plant to distributors’ warehouses and then sold to customers via bricks-and-mortar retailers.
Finally, you can order premixed concrete delivered by truck (so-called "ready-mix" concrete). End-users such as building contractors would not see the actual cement but just get the ready-mix concrete delivered to them.
2. Cement companies have moats
My interest in cement comes from the fact that it generates significantly more profit than any other building material:
The reason why cement companies are profitable seems to be a combination of high value-add to consumers and oligopolistic industry structures in local cement markets.
As a rule, heavy building materials are more profitable than light building materials:
Heavy building materials: Cement, aggregates. Typically outperform inflation thanks to oligopolistic structures and limited substitutes.
Light building materials: Flat glass, plasterboard, insulation, etc. They typically underperform inflation due to intense competition.
The critical issue with light building materials is that they have a lower weight to value ratio and can therefore be transported at greater distances economically. The ease of transport leads to significant competition with other substitutes.
Conversely, cement and aggregates have a high weight to value ratio, limiting the market area to 100-200km. A typical plant produces 1 million (metric) tons of cement per year, enough capacity to supply a city of 2-4 million inhabitants. In other words, one cement plant is typically enough to supply the entire population of a city.
The cost of a cement plant with a 1 million tons capacity is about US$200 million, equivalent to almost 30 years of turnover. With high capital costs and low variable costs, it would be suicide for new entrants to enter a market with an already-existing cement plant. The new entrants would risk low utilisation rates for extended periods of time.
Securing a license makes it difficult to set up a new plant. Environmental restrictions have further increased the barriers to entry for competitors. In addition, noise pollution and frequently heavy traffic can lead to NIMBYism, increasing the barriers to entry further.
Such barriers to entry are most significant in developed markets. And less so in emerging markets where environmental concerns tend to be an afterthought.
In emerging markets, distribution is another barrier to entry for new competitors. Distributors typically have long-term (10 years+) relationships with retailers, and those relationships tend to be challenging to break.
On the supply side, distributors are typically exclusive to a single cement producer, providing them with warehouses, trucks, mixers and other necessary equipment for transport.
The threat of overseas competition is limited:
The high weight-to-value ratio of cement makes shipping uneconomical.
Cement is shipped in clinker form, which requires further processing at the import destination. Such processing facilities are typically owned by the dominant cement producers in each country, though not always.
Bulk shipping of clinker requires specialised ships and terminal facilities, which are scarce and typically owned by the primary producers in each country.
However, transporting cement via water is cheaper than via trucks or rail. There are several instances where overseas competition has mattered a great deal for supply & demand, especially in emerging markets.
All these barriers to entry have led to strong pricing power for cement producers. Historically, cement prices have risen with overall consumer price inflation for most countries. They can be volatile across the cycle, however.
The cash cost per ton of cement of about US$20-40/ton in emerging markets, divided into the following:
20% maintenance & repairs
20% electricity
20% fuel
25% labour
15% other
Overall, though, the capital costs of a cement plant are high, and depreciation remains a high cost for any producer. The critical driver of profitability is, therefore, the plant utilisation rate. Since electricity and fuel are significant input costs, cement plants also see their margins vary somewhat with coal- and natural gas prices.
The cement industry is cyclical. The reason is that cement plants have to run continuously, while the most important end-market - property construction - is cyclical too. Understanding the sustainable long-term demand for property is key to understanding steady-state plant utilisation rates.
3. How to assess value in the industry
The valuation of cement companies is typically done through any of the following valuation multiples:
EV/ton capacity compared to peers, historical levels or typical replacement costs of US$120-150/ton for greenfield projects, depending on the country.
EV/normalised EBITDA - somewhere around 7-10x is a good start.
Price/tangible book value, depending on the projected return on tangible equity.
The aggregates business is also high-quality, thanks to its high weight/value ratio. Reserves of aggregates can be valued at around US$1/ton.
Ready-mix concrete operations typically aren’t worth very much since the operations are small-scale and local, with only moderate barriers to entry.
Brownfield expansion of existing cement plans generates a return of invested capital (ROIC) of about 16% vs greenfield projects’ ROIC of 10% and the typical acquisition’s ROIC of 7%. Therefore, you’ll want to invest in companies focused on organic growth rather than via M&A.
When it comes to greenfield or brownfield development, the opportunities for such projects are greater in emerging markets where the demand is still growing.
4. Recent trends
4.1. Government carbon emission targets
The most significant recent trend in the cement industry has to do government carbon reduction targets. 132 countries are currently working towards “net zero” goals, aiming to maintain a balance between the greenhouse gases going in and out of the atmosphere.
To achieve this goal, regulators are setting up carbon markets to internalise the negative externalities from carbon emissions:
In voluntary carbon markets, companies trade “carbon offsets” from other projects to offset their own carbon emissions. Renewable energy offsets could include wind power, solar power, hydroelectric power, biofuel and nuclear energy projects.
In cap-and-trade systems, government establish emission caps. Companies below the cap can then trade their emission rights to companies that don’t meet the requirements. The government essentially specifies the amount of carbon emitted and then lets the market set a price for that carbon in line with supply and demand.
The European Union proposes a border adjustment mechanism whereby EU importers will need to buy carbon certificates matching what would have been paid had the goods been produced in the EU.
The EU carbon emission cap in billion tons is going to narrow gradually at a rate of about 2% per year:
The EU is at the forefront of introducing emission trading schemes, covering power generation, energy-intensive industries such as cement, aviation and shipping. In the US ex-California, only power generation will be covered by 2023.
In Asia, several East Asian countries are adopting net-zero targets, as can be seen from the middle chart below:
The Chinese carbon market is still not mainly developed and will only have a small impact on cement companies in the short term. While China is introducing a cap-and-trade scheme, the allowances are large and only cover the power generation sector. However, a market for carbon pricing has been introduced with the Guangzhou Futures Exchange, suggesting a future tightening of the carbon market.
Southeast Asian countries are taking a wait-and-see approach regarding cap-and-trade systems or carbon taxes. They do target reduced carbon dioxide emissions, but progress will be slow. It looks like Indonesia will introduce a carbon tax in April 2022, but only for coal plants at this stage. I do not foresee a significant impact of carbon emission trading systems on ASEAN cement stocks in the near- to medium term.
4.2. Carbon emission reduction technologies
Further, there are many ways that carbon emission reduction could occur, including through material, energy and capture technologies.

I’m not going to bore you with details, but the critical point here is that many new technologies are being developed that will lead to lower CO2 emissions - but at a cost. As long as cement lacks direct substitutes, end-user demand will not change dramatically, and the higher cost burden will be distributed across the supply chain.
5. Country-by-country comparisons
In recent decades, the demand for cement has gone up materially. Emerging markets such as China have been a key driver.
A significant increase in the demand for cement typically coincides with changes to political structures, such as the introduction of private land ownership or long-term land leases in former Communist nations such as Russia, China and Vietnam.
China represents the majority of world cement production, producing well over 2 billion tons per year. China has consumed roughly 5x as much as the rest of Asia combined over the past decade and almost 10x more than India. China is truly an anomaly in the emerging market universe.
However, the profitability of Chinese cement companies has lagged those of Europe and Latin America, most likely due to state-ownership with few profit incentives.
Per capita, China stands out as well. Countries early on in their development typically consume around 100-200kg of cement per capita and year. The number for mature economies is closer to 400-500kg. China has been consuming close to 1,700 kg per capita over the past decade.
Among other Asian countries, India, Indonesia, Myanmar and the Philippines are early-stage markets, whereas Malaysia, Vietnam and Thailand are considered mature.
6. International cement markets
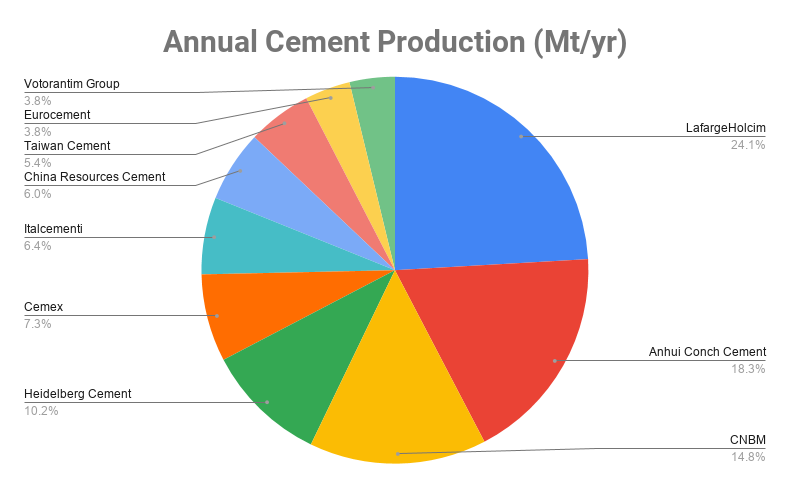
The largest cement companies in the world are Switzerland-based Holcim (previously known as LafargeHolcim), China’s Anhui Conch Cement, Germany’s Heidelberg Cement and Mexico’s Cemex. These all have significant exposure to Asian emerging markets through their subsidiaries.
As you can see from the below chart, China’s cement output peaked in 2014 and is now flat-lining. There is over-construction in the property industry - China’s residential property construction in square metres per capita is now roughly three-fold the Southeast Asian average. China is commonly seen as a mature cement market.
There is a risk that excess capacity will spill over into the export market destined for Southeast Asia. However, that has not occurred so far. China only exports around 12 million tons of cement each year as capacity is inland and does not have access to sea-borne or river-borne distribution.
Most of China’s cement companies are state-owned enterprises with poor profitability. An exception is Anhui Conch, whose margins are high - almost suspiciously high. Further, given the current situation of over-construction, we are likely to see cement company margins drop over time.
The two Japanese cement companies, Sumitomo Osaka and Taiheiyo Cement, trade at record low multiples at significant discounts to tangible book value. The former just announced a buyback program. That said, their top-line growth was tepid even before the pandemic. Construction projects are likely to resume post-COVID-19, which could serve as a catalyst.
India’s cement market has promise, but Ultratech Cement and its peers trade at very high multiples.
I have excluded Vietnamese and Pakistani cement producers since few of us have broker access to these markets.
7. Southeast Asian cement markets
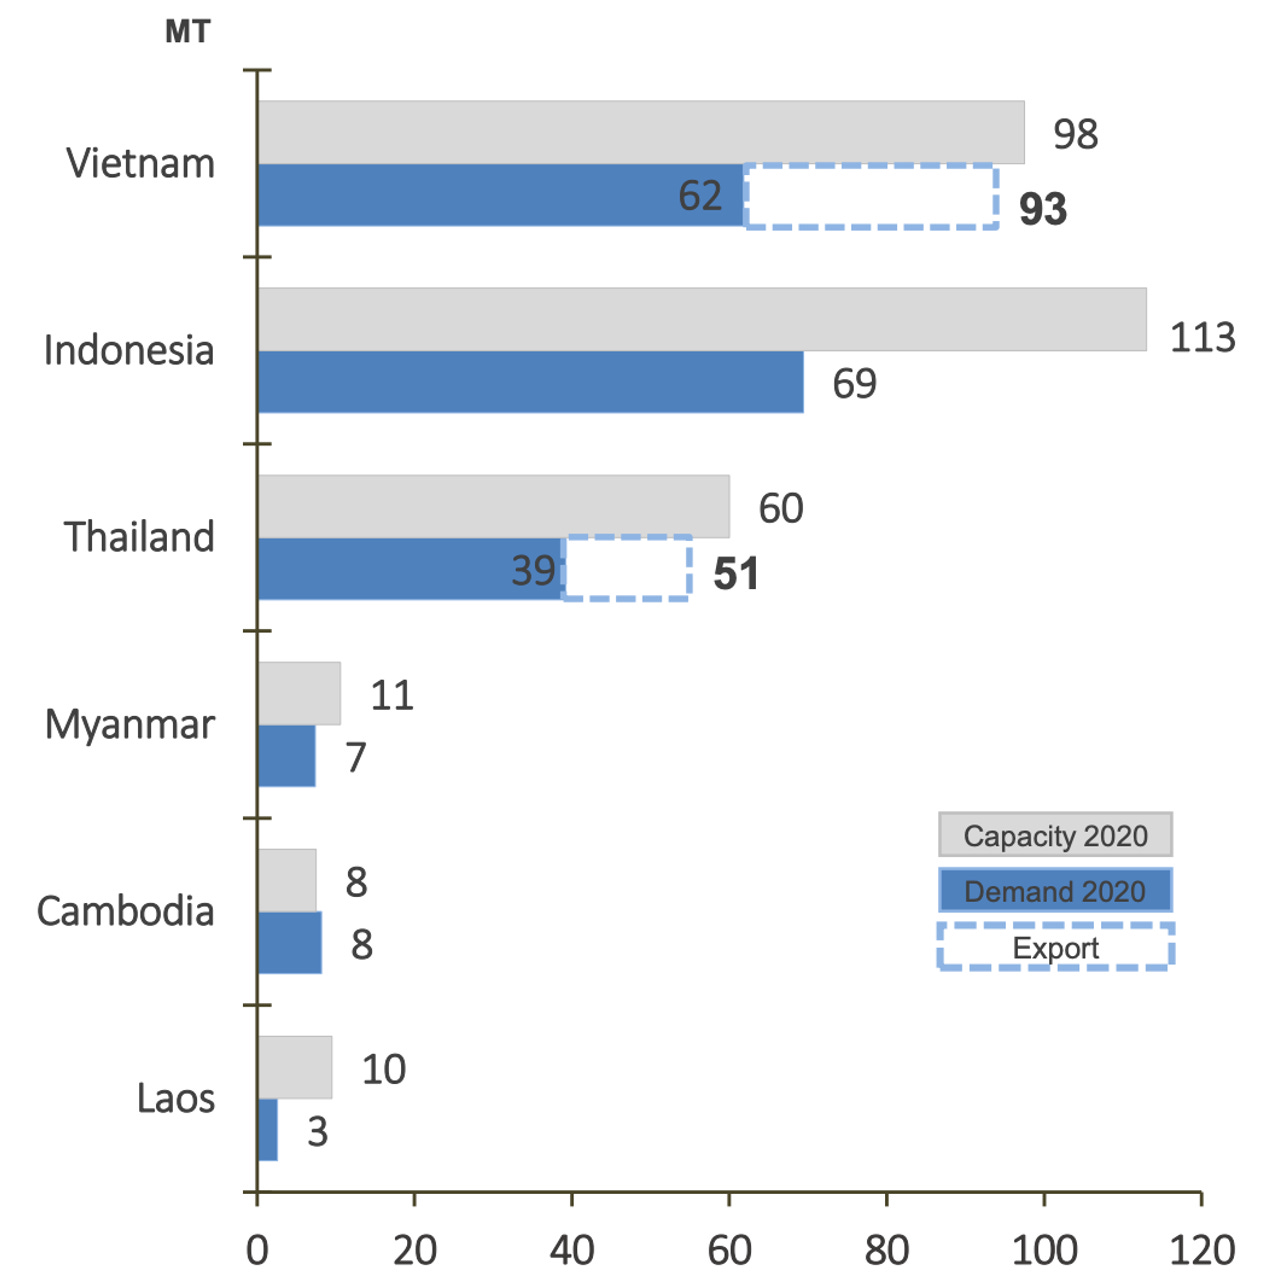
The following chart is an excellent summary of the supply & demand situation for several of the main countries in Southeast Asia.
As you can tell from the above chart, there is excess capacity in Indonesia. Vietnam and Thailand have excess capacity for domestic consumption but are able to export remaining capacity.
The cement markets in Malaysia and the Philippines (not in the chart) seem more balanced. Note that Singapore gets most of its cement from its northern neighbour Malaysia.
7.1. Malaysia
Following the Asian Financial Crisis, cement demand in Malaysia increased at a steady rate, driven by residential property- and infrastructure construction. However, the Malaysian property market weakened from 2015 due to restrictions on foreign buyers of property. Malaysia’s consumption per capita of 500kg puts the country in the mature cement market category, so it is unclear what will cause the market to recover.
In addition, industry capacity increased significantly between 2010 and 2015, leading to a price war from MYR 280/ton to MYR 190/ton in 2019 (US$45/ton) for bulk cement before rebounding in 2020.
Malayan Cement dominates peninsular Malaysia (in the West) while Cahya Mata Sarawak controls the Borneo market (in the East).
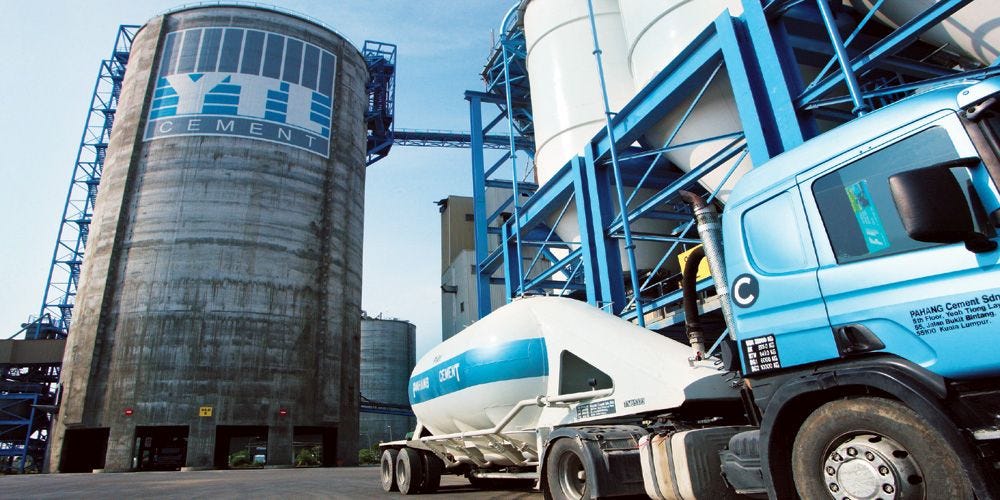
Lafarge Malaysia changed its name to Malayan Cement after being acquired by local conglomerate YTL in 2019. Malayan Cement currently enjoys a market share of almost 40% within Malaysia. It owns 18 cement plants across Malaysia, Singapore, China, Vietnam and Myanmar. In 2021, the parent company YTL injected further cement-related assets into the ListCo, funded by a low-priced equity raise. The company is also stingy with its dividend payments.
Within Peninsular Malaysia, the major competitors are Hume Cement (a subsidiary of Hong Leong), CIMA and Tasek Industries. On Borneo, listed Cahya Mata Sarawak controls the market and has also branched out into other construction materials, property development, etc.
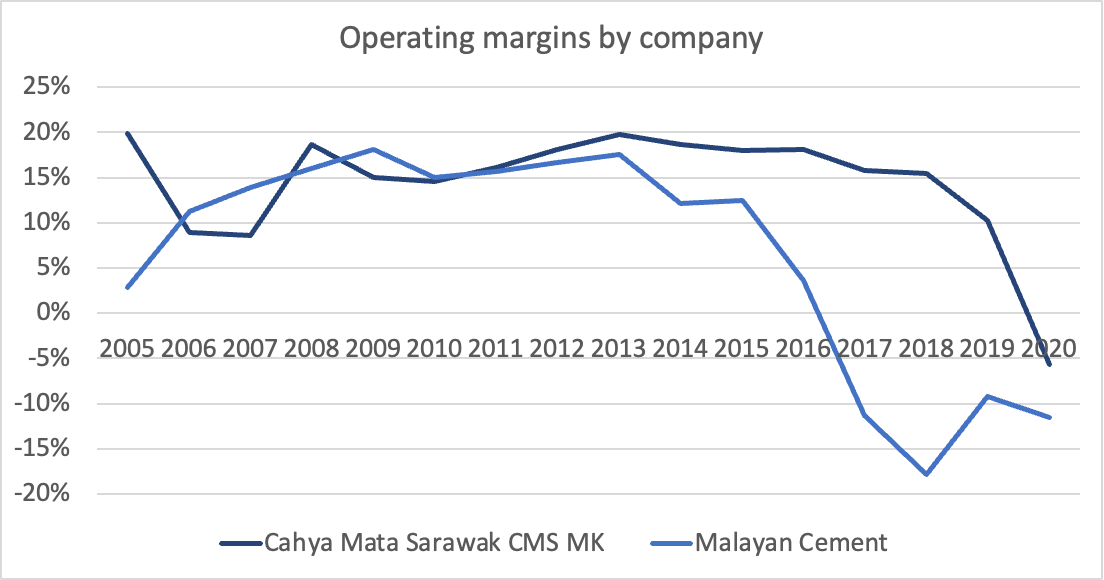
Margins of both Malayan Cement and Cahya Mata Sarawak have both slumped since the downturn in Malaysia’s property sector began around 2015. Recovery would probably require foreign buyers to return to the Malaysian property market.
Malayan Cement trades at almost 3x book for inexplicable reasons. Cahya Mata Sarawak trades at a significant discount to book, though at a high multiple in EV/ton capacity. A sum-of-the-parts valuation considering Cahya Mata Sarawak’s other businesses will likely show a significant discount to NAV.
7.2. Thailand
Thailand cement demand has remained steady over the past 7-8 years. Consumption of 560kg/capita puts the Thai cement market in the mature category.
According to Siam Cement, the current capacity is about 60 million tons. 51 million tons of cement are produced each year, out of which 39 million tons are consumed domestically and 12 million tons exported to other countries. That means that the overall utilisation rate is a reasonably healthy 85%.
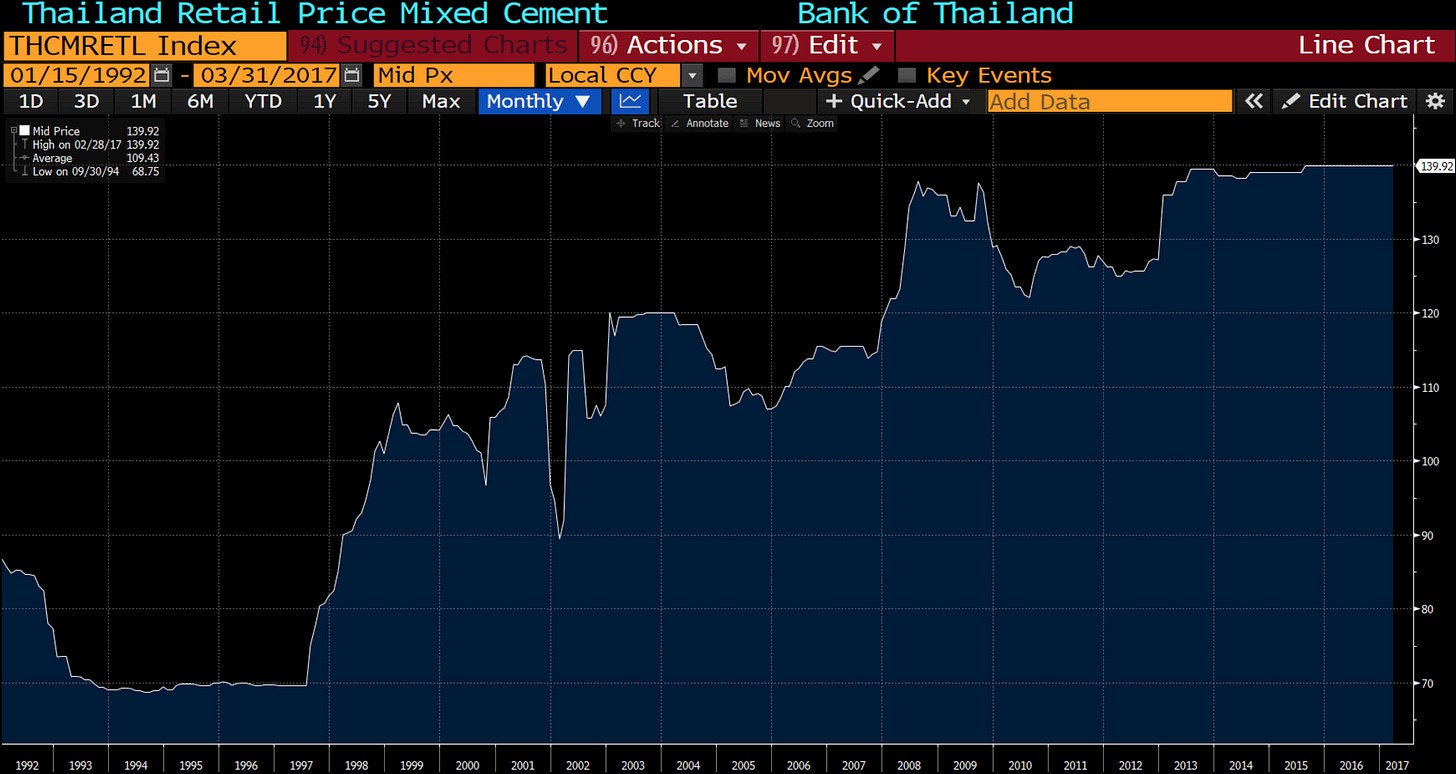
Retail prices for cement in Thailand were strong, at least until 2017, which might be related to the country’s high utilisation rate.
Cement plants in Thailand are mostly centred around the capital Bangkok:
The leading cement company Siam Cement’s largest business is chemicals, with cement only representing 30% of total revenues. Siam Cement is also the biggest paper maker in the ASEAN region.
In terms of cement, the company controls close to 30 million tons in total capacity across the region. When it comes to cement, the company is unique in the way that it’s vertically integrated through its ownership of building materials retailer Siam Global House.
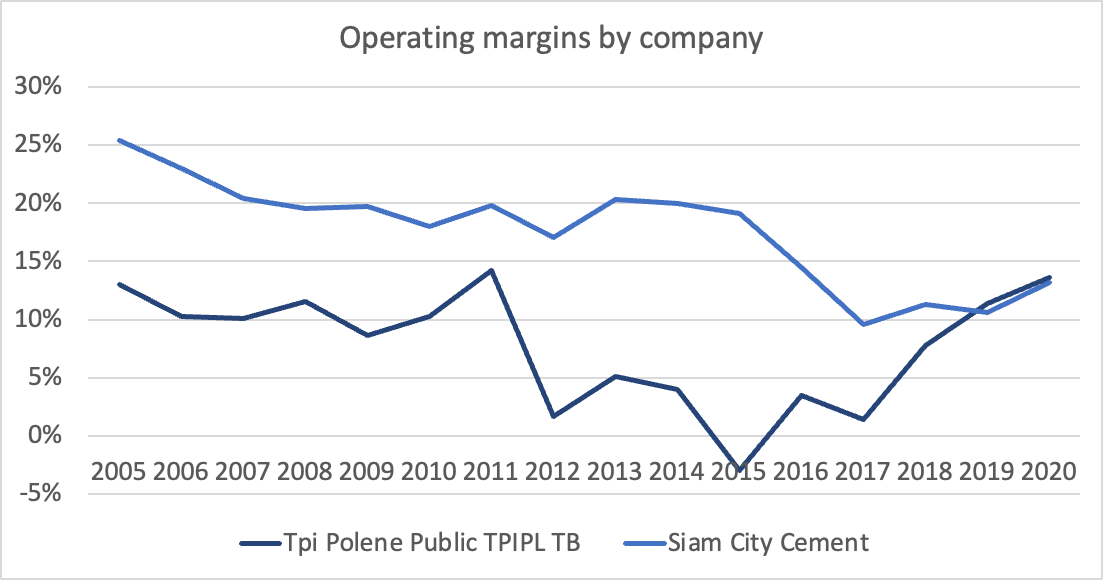
The second-largest cement producer in Thailand is TPI Polene has 50% exposure to construction materials and the rest of its revenues from utilities and petrochemicals. It appears that TPI Polene is making significant losses in its construction materials business.
The valuation multiple of Siam Cement looks reasonable in the short run, given the low P/E ratio and high dividend yield. However, I do not view the sustainability of its earnings from paper and petrochemicals businesses.
7.3. Indonesia
Indonesia’s cement market has been in a bear market since the boom days in the early 2010s and currently stands at 65 million tons/year. Following this date, demand growth decelerated while supply ramped up significantly.
The result is that Indonesian cement plants have now reached meagre utilisation rates of just 60%.
The supply shock caused cement prices to fall from IDR 950,000/ton to IDR 750,000/ton, equivalent to roughly US$52/ton. But another reason for lower prices was orders from President Jokowi for state-owned cement producers (including Gresik / Semen Indonesia) to lower prices, hurting the entire market.
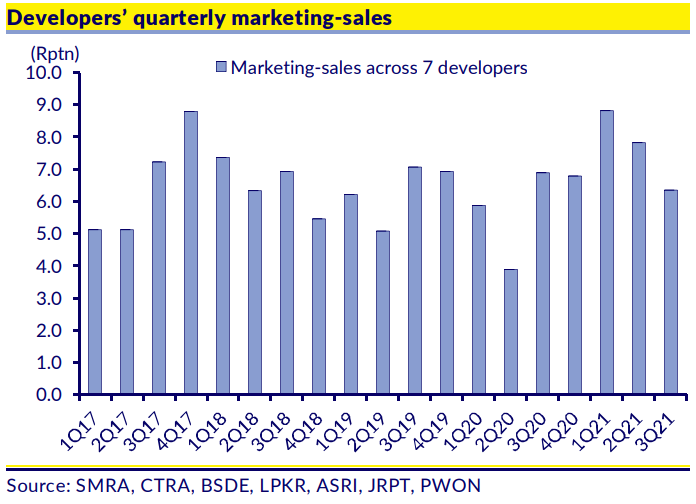
It looks like the demand for cement will pick up now that the property market is recovering from its 8-year slump. Contract sales during COVID-19 have been above 2019 levels. The Indonesian government is adopting easy monetary and regulatory policies to revive the property sector, including lower mortgage rates and loan-to-value requirements.
Demand seems to be shifting from Java to other islands in Indonesia. For example, there is a plan to relocate Jakarta’s capital to Kalimantan. Note that the cement plants with exposure to Eastern Kalimantan are owned mainly by China’s Anhui Conch - not by Indonesian companies. Chinese companies dominate the Eastern Kalimantan cement industry, whereas Indocement and Semen Indonesia dominate Java.
Indonesia's big three cement producers account for 90% of the production capacity. The market leader is state-owned Semen Indonesia (formerly Semen Gresik). Semen Indonesia is a typical state-owned enterprise that responds to government pressure and is generally inefficient. It is focused on growing volumes rather than profitability. Semen Indonesia acquired the high-quality operations of Holcim Indonesia in 2018 for US$917 million.
The second-largest cement company Indocement is 51% owned by Heidelberg Cement and is seen as the higher-quality company of the two. Its plants are in strategic locations in West Java and enjoy higher efficiency levels. China’s Anhui Conch entered the market in the early 2010s, accounting for a large proportion of capacity increases since then.
The overcapacity in the industry has led to weak operating margins across the board, compared to the heydays of the early 2010s. That has been true across Semen Indonesia, Indocement and Semen Baturaja. Note, however, that the post-2018 numbers for Semen Indonesia are not like-for-like given its acquisition of Holcim Indonesia.
Indonesia’s blue-chip cement company Indocement trades at a reasonably high multiple, though at lower levels than in the 2010-15 period. Same situation for Semen Indonesia and Semen Baturaja. I believe the current overcapacity will over time disappear, given Indonesia’s low- and still growing cement volumes - but it might take a decade or longer.
7.4. The Philippines
Cement consumption in the Philippines is about 320kg/capita, between India, Indonesia and more developed Asian countries such as Malaysia and Thailand. There is still decent upside for volume growth.
The overcapacity in the Philippines does not look as severe as that of Indonesia. Total industry capacity is around 45 million tons compared to normalised post-COVID-19 demand of about 35 million tons. Utilisation levels have averaged approximately 75% or so.
A problem has been competition from cheaper cement from Vietnam. Weaker-than-expected infrastructure demand, higher capacity and competition from Vietnamese imports caused the cement price in the Philippines to drop 10% from 2016 levels until 2020.
In 2019, the Philippines imposed restrictions on the import of cement from Vietnam to protect its domestic industry from the cheaper competition with a levy of US$5 per metric ton. The new measure will lapse in October 2022, and there is no clarity on whether the import levy will continue.
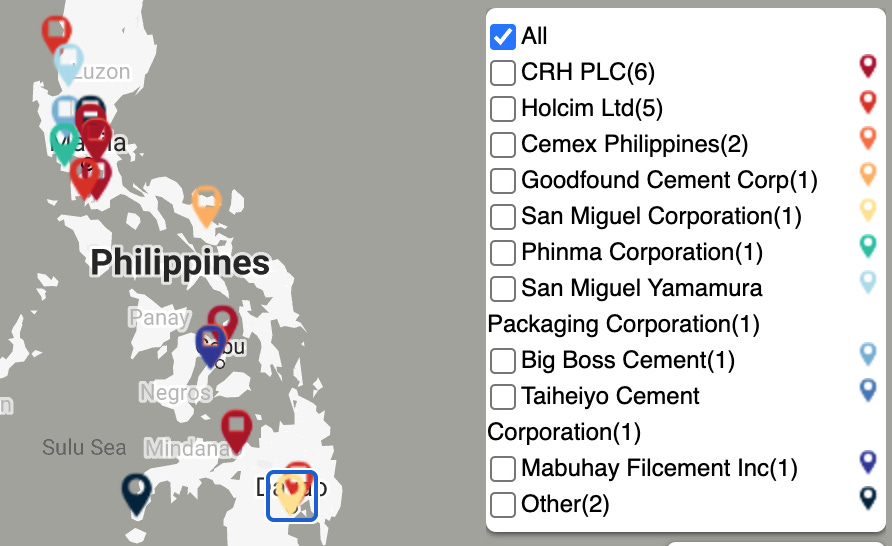
The largest cement company locally is Holcim Philippines, followed by Aboitiz-owned Republic Cement and Mexico’s Cemex’s subsidiary Cemex Philippines. San Miguel’s Eagle Cement is another smaller competitor. Holcim is perceived as the market leader in terms of efficiency, though Republic Cement and Cemex also own several well-regarded cement brand names. Both Cemex and Eagle Cement have questionable corporate governance structures with significant exposure to related party transactions.
Holcim Cement’s margins dropped by about half since the early 2010s, primarily due to overcapacity issues. Cemex has also suffered since the 2016 peak.
The Philippines remains among the cheapest cement markets anywhere. Mexico’s Cemex’s subsidiary Cemex Philippines now trades below tangible book, though it has questionable corporate leadership. High-quality multi-national Holcim Philippines now trades at the lowest price/book it has seen in decades, despite the second-highest return on invested capital in the entire industry. Holcim Philippine’s EV/ton capacity of US$85 is at levels I consider to be attractive.
Here is my report on Holcim Philippines. Access it by clicking the picture below.
8. Conclusion
Value investors love cement companies as they perceive them to have local monopolies. There is some truth behind this idea. But cement companies are also cyclical, and overcapacity can persist for decades.
In Southeast Asia, the healthiest supply and demand situation can be found in Thailand. The Indonesian cement market is oversupplied, while the Philippine cement market is somewhere between. But with low consumption volumes so far, the oversupply in Indonesia and the Philippines will likely improve over time.
Philippine cement companies stand out at current market prices with low EV/ton capacity and low price/tangible book. The return of capital flows from overseas Filipino workers (OFW) will likely boost the domestic property market. In addition, Philippine infrastructure projects are likely to resume as COVID-19 transforms from a pandemic to endemic, less-harmful disease. The only question mark is the Philippine presidential election in May 2022 and the potential removal of import duties on cement in October 2022.















Never though about cement, very good information!
interesting that capacity expanded in indonesia as utilization declined. A shame that companies continued to invest. Where is the supply side picture the best? How has capacity changed in malaysia in recent years?