Disclaimer: Asian Century Stocks uses information sources believed to be reliable, but their accuracy cannot be guaranteed. The information contained in this publication is not intended to constitute individual investment advice and is not designed to meet your personal financial situation. The opinions expressed in such publications are those of the publisher and are subject to change without notice. You are advised to discuss your investment options with your financial advisers. Consult your financial adviser to understand whether any investment is suitable for your specific needs. I may, from time to time, have positions in the securities covered in the articles on this website. This is not a recommendation to buy or sell stocks.
Summary
Australia has enjoyed an unprecedented housing boom driven by low interest rates, a boom in commodity exports and immigration from mainland China.
Housing has now become unaffordable. Affordability ratios, rental yields and the value of the housing stock/GDP are now close to the bubble levels.
The rent 410bps spike in interest rates will cause serious pain among Australia’s 2.0 million landlords who are relying on capital gains to help pay for their mortgages.
China’s closing off from the rest of the world from 2016 onwards suggests that immigration to Australia will probably be on a slow decline in the next decade or two.
It’s hard to predict how a housing bust might play out, but probably through a combination of a weaker Australian Dollar, weaker household spending and building non-performing loan ratios among the Australian banks.
The backdrop
Australia has enjoyed a 30-year bull market in housing.
The bull market began after the recession of 1991, which was sparked by a record-high interest rates of 17%. At the peak, unemployment reached 11% and took several years to recover.
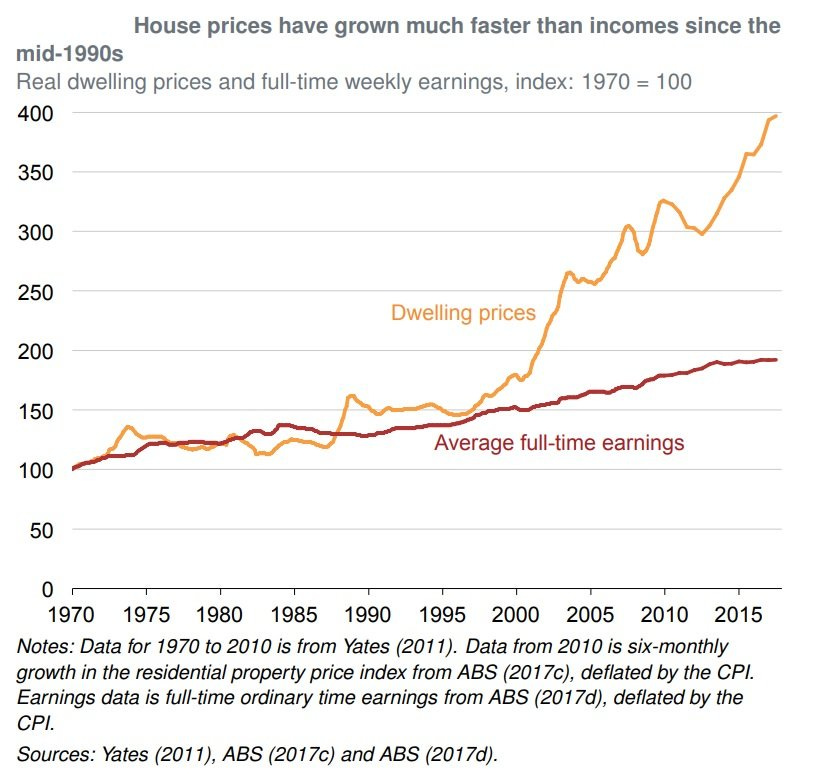
But that recession also sowed the seeds of an economic recovery and a boom that lasted almost 30 years. Since the 1991 recession, Australian housing prices have now gone up roughly +270%:
The first leg-up came around the year 2000 when the government introduced the First Home Buyer Grant: one-off grants to first homeowners that satisfy certain eligibility criteria. For example, in New South Wales, new home buyers can get an AU$10,000 grant provided that the home's total cost does not exceed AU$600,000. This grant was later increased in 2009 in response to the Great Financial Crisis.
In the mid-2000s, Australia enjoyed a boom driven by a seemingly insatiable demand for commodities in mainland China. Strong demand for Australian iron ore, coal and other commodities caused nominal GDP growth to remain in the high single digits for most of the 2000s.
But the boom was also driven by migration flows from mainland China and elsewhere. Many Chinese saw Australia as a desirable place to live. You can tell from the following chart that net overseas migration accelerated from the mid-2000s onwards, with the population growing 1-2% per year.
In 2008, the government relaxed the rules for non-resident investors in the Australian housing market, making it easier for them to buy property. New rules also relaxed the credit guidelines for temporary residents, allowing them to buy homes with just 10% deposits.
The boom was also driven up by the gearing up of Australian households. Today, Australia’s household debt of 180% of income is far beyond the levels experienced by the United States before the Great Financial Crisis. Measured against GDP, Australia now ranks the second-highest of any country after Switzerland. This debt introduced enormous financial instability.
What’s worse is that 70% of Australia’s mortgage debt is on variable rate terms. So once interest rates rise, higher interest payments will immediately impact household spending power and possibly cause a recession.
During most of the 30-year boom, dwelling completions stayed around 150,000, just in line with household formation. These provided enough housing for about 400,000 people, assuming an average household size of 2.7x individuals.
Once immigration took off, dwelling completions rose to well over 200,000, and the housing market ended up in a frenzied state of activity:
This boom in construction was spurred on by a peculiarity in Australian tax laws that enabled so-called “negative gearing”: using losses from rental properties to offset taxable income from labour. This practice is now widespread: out of roughly 2 million landlords in Australia, over 1.3 million Australians own loss-making rental properties.
These individuals presumably hope for capital gains to offset any losses they make on their rental properties. But this type of speculative finance could lead to a frenzy of selling if and when property prices start falling.
Today, the affordability of Australia’s residential property market can be measured in a few different ways:
The Australian housing market is worth roughly 400% of GDP, just below Japan’s 1989 peak of around 500%, similar to China’s level today. Counting just the land - the most interest-rate sensitive asset - you get to 320%, the same level as Japan in 1989.
According to the Demographia International Housing Affordability Survey, Sydney and Melbourne rank as some of the least affordable cities based on the median house price/median household income (known as the “affordability ratio”). Australia has a median affordability ratio of 8.2x, up from about 3-4x before the boom started in the early 1990s.
In Australia’s largest cities, rental yields are now between 3-4%, meaning that any investor in rental property would need over 30 years to get back money once maintenance is taken into account. Before the boom, residential property yields were closer to 6%.
In any case, these three measures all suggest severe overvaluation of the property market. And once credit and immigration stop supporting the market, it’s hard to say where the floor will be.
Clouds are forming
Housing markets tend to weaken in either of two scenarios:
When interest rates rise sharply or
When people lose their jobs
This is especially true when debt levels are high, and a large portion of borrowing has occurred at variable rates.
I will argue that Australia will likely face both challenges simultaneously.
The following chart shows how Australia’s policy rate - RBA cash rate - has recently spiked from zero to 4.1%:
For context, a typical mortgage rate now costs 6.6% compared to just above 2% in 2021 - the highest level since 2012.
With a median home price of AU$913,000, a 25-year repayment term and an assumed 80% loan-to-value ratio, a borrower will be looking at a monthly payment of almost AU$5,000 per month, including amortisation.
But with typical salaries of AU$60,000 and combined household gross income of AU$120,000, the monthly mortgage payments will eat up 61% of household disposable income after tax, according to my numbers. Correct me if I’m wrong. In the past, I’ve considered any number above 30% a red flag.
RBA’s rate hikes are made worse by an ongoing mortgage rate reset. During the COVID-19 years, the RBA offered banks low-cost fixed-rate loans to the major banks for three years. Almost AU$200 billion was lent through this program, enabling banks to lend at fixed rates at under 2% for years. But most of those loans are maturing in 2023, and mortgage rates will reprice higher.
We’re seeing early signs of mortgage delinquencies rising, though from low levels. According to Moody’s, the delinquency rate among the bottom third percentile went up 0.6 percentage points from May 2022 to May 2023.
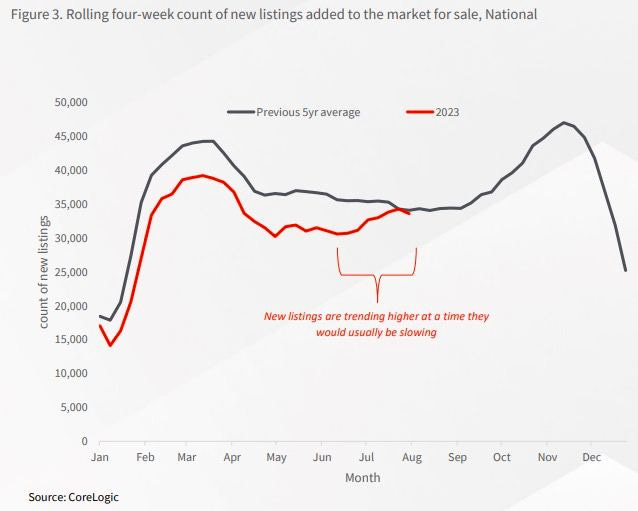
And in mid-2023, we started seeing an uptick in the number of new listings added to the market for sale, suggesting pain among existing homeowners:
On the income side, fundamentals are also deteriorating. Real wages have declined since 2021 due to high inflation and a weaker economy.
Australia’s Achilles' heel is that it primarily exports commodities like coal, iron ore, and hydrocarbons. Roughly a third of Australia’s exports are to mainland China, making the economy susceptible to China’s housing market.
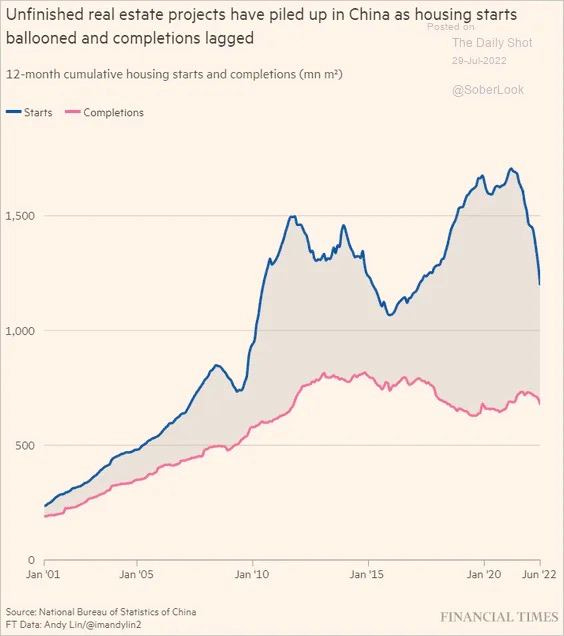
In my view, China’s construction boom is probably over. The bonds of China’s private property developers are weak across the board, suggesting widespread default. They are not going to ramp up capex anytime soon. General Secretary Xi Jinping has repeatedly emphasised that property is for living - not for speculation. I would not assume that construction activity will recover anytime soon.
This weakness in construction implies low demand for industrial commodities for the foreseeable future.
Now, when it comes to employment, Australia’s job market is still strong. However, early signs are showing that the job market is rolling over. For example, the number of job vacancies has now started decreasing and trending in the wrong direction:
The big wild card is how long migration from mainland China can support the property market. As of August 2023, the number of Chinese nationals that took up short-term residence in Australia rose to 276,000, exceeding the pace of immigration in the same period in 2019. In theory, such newcomers will need 100,000 homes annually, providing at least short-term support for the market despite the hike in interest rates.
But let’s not overemphasise the impact of overseas buyers on the Australian property market. Their share of the market has gone from about 8% at the peak to just about 3% today. A tightening of capital controls from 2016 onwards caused this decline. It’s no longer a simple matter to get money out of China. I would not expect such demand to last forever.
The potential casualties
Keep reading with a 7-day free trial
Subscribe to Asian Century Stocks to keep reading this post and get 7 days of free access to the full post archives.


