Alternative data for dummies
Estimated reading time: 18 minutes


Disclaimer: Asian Century Stocks uses information sources believed to be reliable, but their accuracy cannot be guaranteed. The information contained in this publication is not intended to constitute individual investment advice and is not designed to meet your personal financial situation. The opinions expressed in such publications are those of the publisher and are subject to change without notice. You are advised to discuss your investment options with your financial advisers. Consult your financial adviser to understand whether any investment is suitable for your specific needs. I may, from time to time, have positions in the securities covered in the articles on this website. This is not a recommendation to buy or sell stocks.
Summary
- Alternative data (“alt-data”) can help predict the likelihood of an earnings beat.
- But for alternative data not to be priced in, it needs to be obscure. Luckily, institutional investors aren’t paying much attention to alt-data yet. At least not when it comes to consumer stocks in the Asia-Pacific.
- In this post, I share my 12 favorite alternative data sources, including Google Trends, Subreddit Stats, and Toolforge.
- I also demonstrate how I use each of these alternative data sources by discussing the example of Sanrio — one of Asia’s hottest consumer stories.

In this previous post, I made the case that value investing should be combined with momentum investing.
Why? Because value works best in the long term, whereas momentum works best in the short term. By combining the two, you get the best of both worlds.
But momentum investing is challenging. To predict the near-term buying and selling of other investors, we need to predict events and figure out how investors will respond to them.
That’s why I pay attention to alternative data (“alt-data”) sources. In this day and age, companies throw off huge amounts of information that can be readily accessed through the Internet. And much of that data is obscure enough that it’s not yet priced-in when it comes to individual share prices.
In this post, I’ll introduce my favorite alternative data tools, whether free or paid. I’ll also explain how I use them in practice.
To explain each of the tools more vividly, I’ll take the example of Hello Kitty-brand owner Sanrio, which I wrote about in 2021 and remains one of Asia’s hottest growth stories.
Table of contents
1. Why alt-data matters
2. Introduction to Sanrio
3. My favorite alt-data sources
   3.1. Google Trends
   3.2. Subreddit Stats
   3.3. Toolforge
   3.4. TickerTrends
   3.5. Social Blade
   3.6. Camelcamelcamel
   3.7. Idealo
   3.8. StockX
   3.9. Data.ai
   3.10. TwitchTracker
   3.11. Steamdb
   3.12. Polymarket
3. Conclusions
1. Why alt-data matters

As Benjamin Graham once said, in the near term, the market is a voting machine. Investors buy stocks when companies exceed their expectations. Or if something sparks their imagination.
But to predict earnings beats is difficult. It requires us to predict the future. Factors that could have an impact on future earnings include:
- New products
- Meaningful price increases
- New factory completions
- New advertising campaigns accelerating product adoption
- A change in the external environment, for example, interest rate cuts
- The bankruptcy of a large competitor
- A long-term building of supply scarcity
- Regulation that opens up a new market for the company
- Restructuring that helps unlock value
- New management team changing subpar capital allocation
- Overly conservative accounting being ditched
- Reflexive processes, e.g. being able to buy companies cheaply through high-priced shares
These factors are mostly qualitative in nature. Which is fine. I’ll look at a product and see how I feel about it. I can then make a case that, say, a new iPhone will drive growth for Apple.
But to truly gain conviction that earnings are going to surprise to the upside, we need shorter-term and more reliable leading indicators.
That’s where alternative data (“alt-data”) sources come in handy. They’re obscure enough for the sell-side and for investors not to take them seriously. Their usefulness is only applicable in certain situations, limiting their appeal to institutional investors.
So, I use alt-data in the following way:
- I first develop a theory about why a particular product will sell better over time
- I then try to figure out what alt-data sources can be used to track consumer behaviors
- Finally, I look at year-on-year growth numbers to understand the likely magnitude of an expected earnings beat
Alt-data is best used in fast-moving industries where fads and new trends are likely to occur. That’s why I like the consumer discretionary industry. And I also like software products where usage data can be measured with great precision.
2. Introduction to Sanrio (8136 JP)
Throughout this post, I’ll analyze the prospects of Japanese brand developer Sanrio. This is by no means a recommendation of stocks—Sanrio is just a convenient example to demonstrate how I use the tools below.
I first wrote about Sanrio in 2021, when the latest Hello Kitty craze was just getting started. You can find my old write-up on the stock here:
 Michael Fritzell
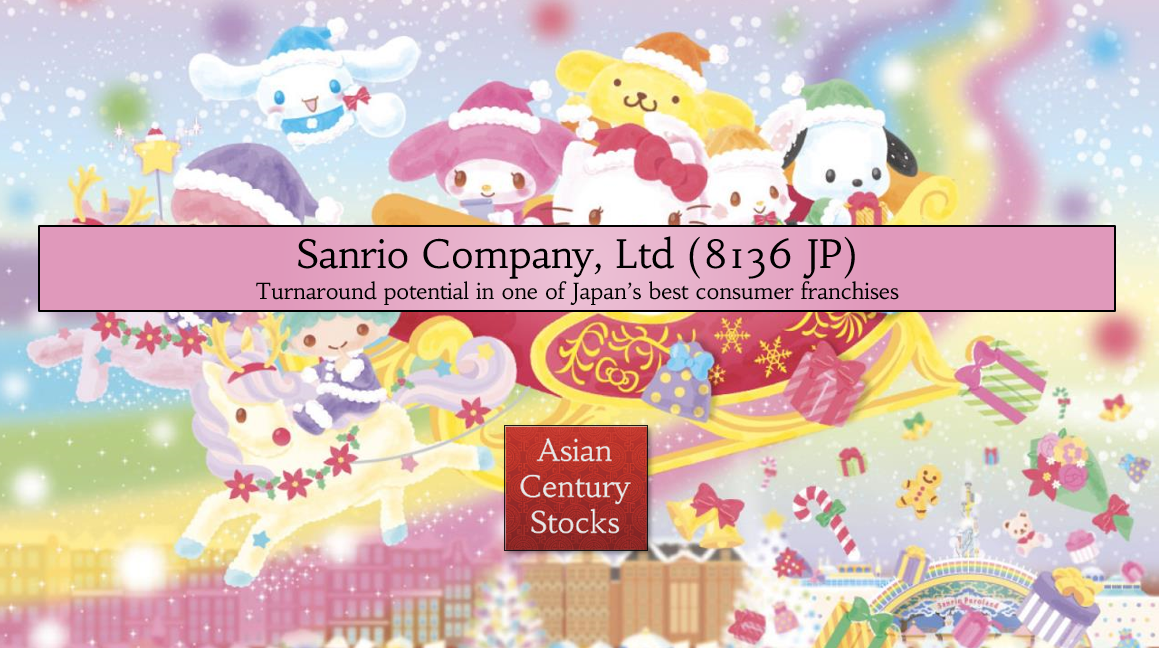
I felt at the time that Sanrio had a fantastic portfolio of intellectual properties. Hello Kitty was the second-highest-grossing media franchise ever, having raked in US$80 billion to date - higher than Mickey Mouse, Super Mario, and Star Wars.
What made Hello Kitty unique was the character's cuteness and distinctive look. Her lack of a mouth allowed fans to project their emotions onto her.
Sanrio had been mismanaged after the founder’s son Kunihiko Tsuji passed away in 2014, causing a vacuum in the top leadership. But in 2019, the founder’s grandson Tomokuni Tsuji finally took over and started implementing a turnaround plan. A central part of that plan was a centralization of the marketing department to cross-sell each character to existing customers. He also launched a new loyalty app called Sanrio+ to collect customer data, including the customer response to new product launches. And most importantly, he went all-in on collaborations with Levi’s, Razer, Uniqlo, Balenciaga, etc.
From early 2021 onwards, Sanrio’s turnaround became evident in the alt-data I had collected from Google, Instagram and Reddit. I paid particular attention to the sharp increase in Google search queries for “Hello Kitty” and noted the diversification to new characters, including My Melody and Gudetama.
That success was just the beginning of an amazing turnaround for the brand. Since 2021, Sanrio’s stock price has performed beautifully:
This, to me, is a demonstration of how powerful alternative data sources can be. You’d be foolish to ignore them.
3. My favorite alt-data sources
3.1. Google Trends

What it tracks: Google search query volumes
Website: trends.google.com
Cost: Free
My top source for alternative data is Google Trends, which gives you a sense of how much Google users are searching for a particular keyword. The indices are normalized for Google's overall search volume, so the absolute level doesn’t mean anything. Just compare the search query volume index with its historical level or compare the volumes with another keyword.
Data scientist Steph Smith believes that people use Google for one of four reasons:
- Know or understand something better
- Find a particular website
- Complete a task
- Buy something
In my view, when using Google Trends, you should use a keyword that captures user intent — an intent to buy a product.
For example, if you try the keyword “Buy Hello Kitty”, you can be pretty sure that it captures an intent of a user. Or if you search for “Hello Kitty toy”, you can be pretty sure that the user is curious about the Hello Kitty-branded toys.
One trick that I’ve been using is to seasonally adjust the data. The fastest way to do that is to create separate indices for each year, containing the same search query. Here is a template that you can use: seasonal adjustment template. If the line for the latest year is much above the previous year, you can be pretty sure that the sales of Hello Kitty-branded products will increase year-on-year.
Finally, you can use Google Trends to understand consumers better. For example, look at the Hello Kitty page and scroll down. You’ll see that users are also searching for Kuromi — a tomboy character from the My Melody universe that’s become popular recently. If you compare the two search query charts, you’ll get a sense of how important Kuromi is compared to the main Hello Kitty brand. By scrolling down the main Hello Kitty page, you’ll also get a sense of the countries in which Hello Kitty has become popular.
So, judging from the data observed here, it looks like the Hello Kitty brand is doing very well, as are the other brands in the My Melody universe. That bodes well for Sanrio’s future growth prospects.
There are several individuals and publications discussing search query trends. One of my favorite Substacks on the subject is Astutex.ai, which costs US$10/month:
astutex.ai #AlternativeData insightsLatest Astutex Trendspotting report
The person behind the Substack is also active on Twitter @AstutexAI.
I also find the newsletter Trending Data fascinating, as it highlights booming consumer product categories that I wouldn’t have paid attention to otherwise. Hubspot’s newsletter Trends.co also discusses exciting consumer trends in its weekly emails.
3.2. Subreddit Stats
What it tracks: Number of comments and visitors to Reddit forums
Website: Subredditstats.com
Cost: Free
Reddit is one of the largest social platforms in the world. What makes it unique is that the platform is divided into niche communities called “Subreddits”, independently moderated by their members. Whenever a product becomes popular, you’ll get subreddits pop-up catering to its fans.
To find a subreddit, I usually go to Google and just search say “Hello Kitty site:reddit.com”. The first search result that pops up is from the subreddit r/HelloKitty, which apparently has 56,000 members. It looks like their users share photos of their favorite hello Kitty merchandise.
What I like to do next is to go to the Anvaka Github tool to understand what other Subreddits might be relevant for a particular brand or product. In Hello Kitty’s case, it becomes clear that the main Subreddits we’ll want to track are r/HelloKitty and r/Sanrio.
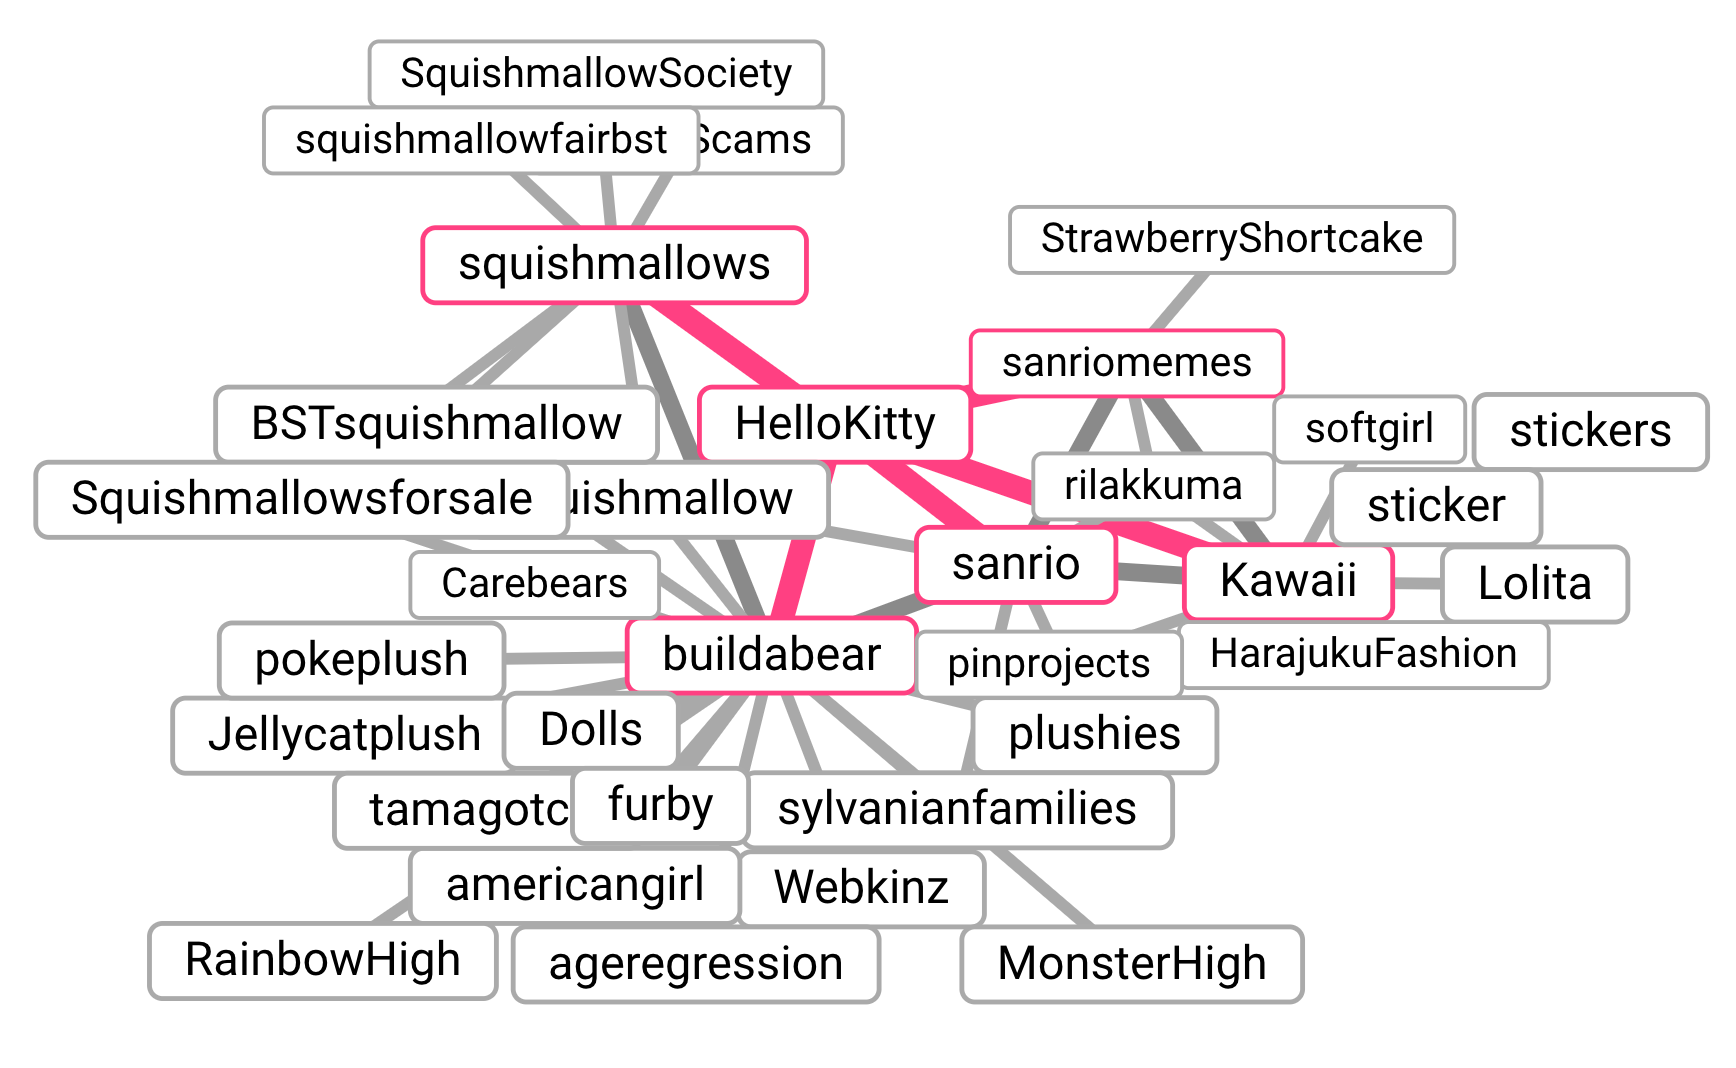
Now, if you search for r/HelloKitty in Subredditstats, you’ll be presented with the following information:
- The number of subscribers for r/HelloKitty in absolute terms
- The ranking of r/HelloKitty among all of Subreddits available on Reddit in terms of the number of subscribers
- The number of comments per day on r/HelloKitty
- The ranking of r/HelloKitty among all of Subreddits available on Reddit in terms of the number of comments per day
- The number of posts per day in absolute terms
The two charts I think contain the most value are #2 and #4, which show the relative ranking of the Subreddit in terms of the number of subscribers and the number of comments per day. We want the ranking to decrease.
You can also plot the year-on-year growth in the number of subscribers to a particular Subreddit, to spot an acceleration in growth.
When it comes to r/HelloKitty and r/Sanrio, their subscriber ranks are getting lower and lower, which means they’re quickly becoming among the top Subreddits on the platform. This is a positive sign for Sanrio, and probably means that its earnings growth will continue to be strong.
Note!
A reader alerted me that Subreddit Stats is no longer being updated due to a 2023 change to Reddit’s API. The Hello Kitty data below only goes up to the end of 2023. I’ve been trying to find an alternative to Subreddit Stats, but to no avail. Your best options are using scraping tools, or the Reddit data offered by TickerTrends paid service.
3.3. Toolforge

What it tracks: The number of times a Wikipedia page has been requested
Website: pageviews.wmcloud.org
Cost: Free
Toolforge is a straightforward service: it tracks the number of times per day or per month that a particular Wikipedia page is being requested by any device. I usually click the date range and then press “All time” to see the page view trend across the longest time frame possible.
To switch to analyzing articles in other languages, add a prefix before the URL, for example, switching from “en.wikipedia.org” to “ja.wikipedia.org” for Japan.
In Hello Kitty’s case, we can see that the number of Wikipedia page views has been increasingly steadily over the past few years, especially since 2021 when the hype really took off. I notice the same trend for the Sanrio page. The Japanese Wikipedia page “ハローキティ” also saw a spike in page views at the end of 2023.
You can also download the data into a CSV file, open it with Microsoft Excel, plot the data in a line chart, right-click the chart line and then press “Add Trendline…”. I prefer polynomial trendlines or moving averages. Judging from Hello Kitty’s trendline, it’s still trending upwards in an exponential fashion.
3.4. TickerTrends
What it tracks: TikTok, YouTube, Reddit, Amazon, website traffic trends
Website: tickertrends.io
Cost: US$19/month
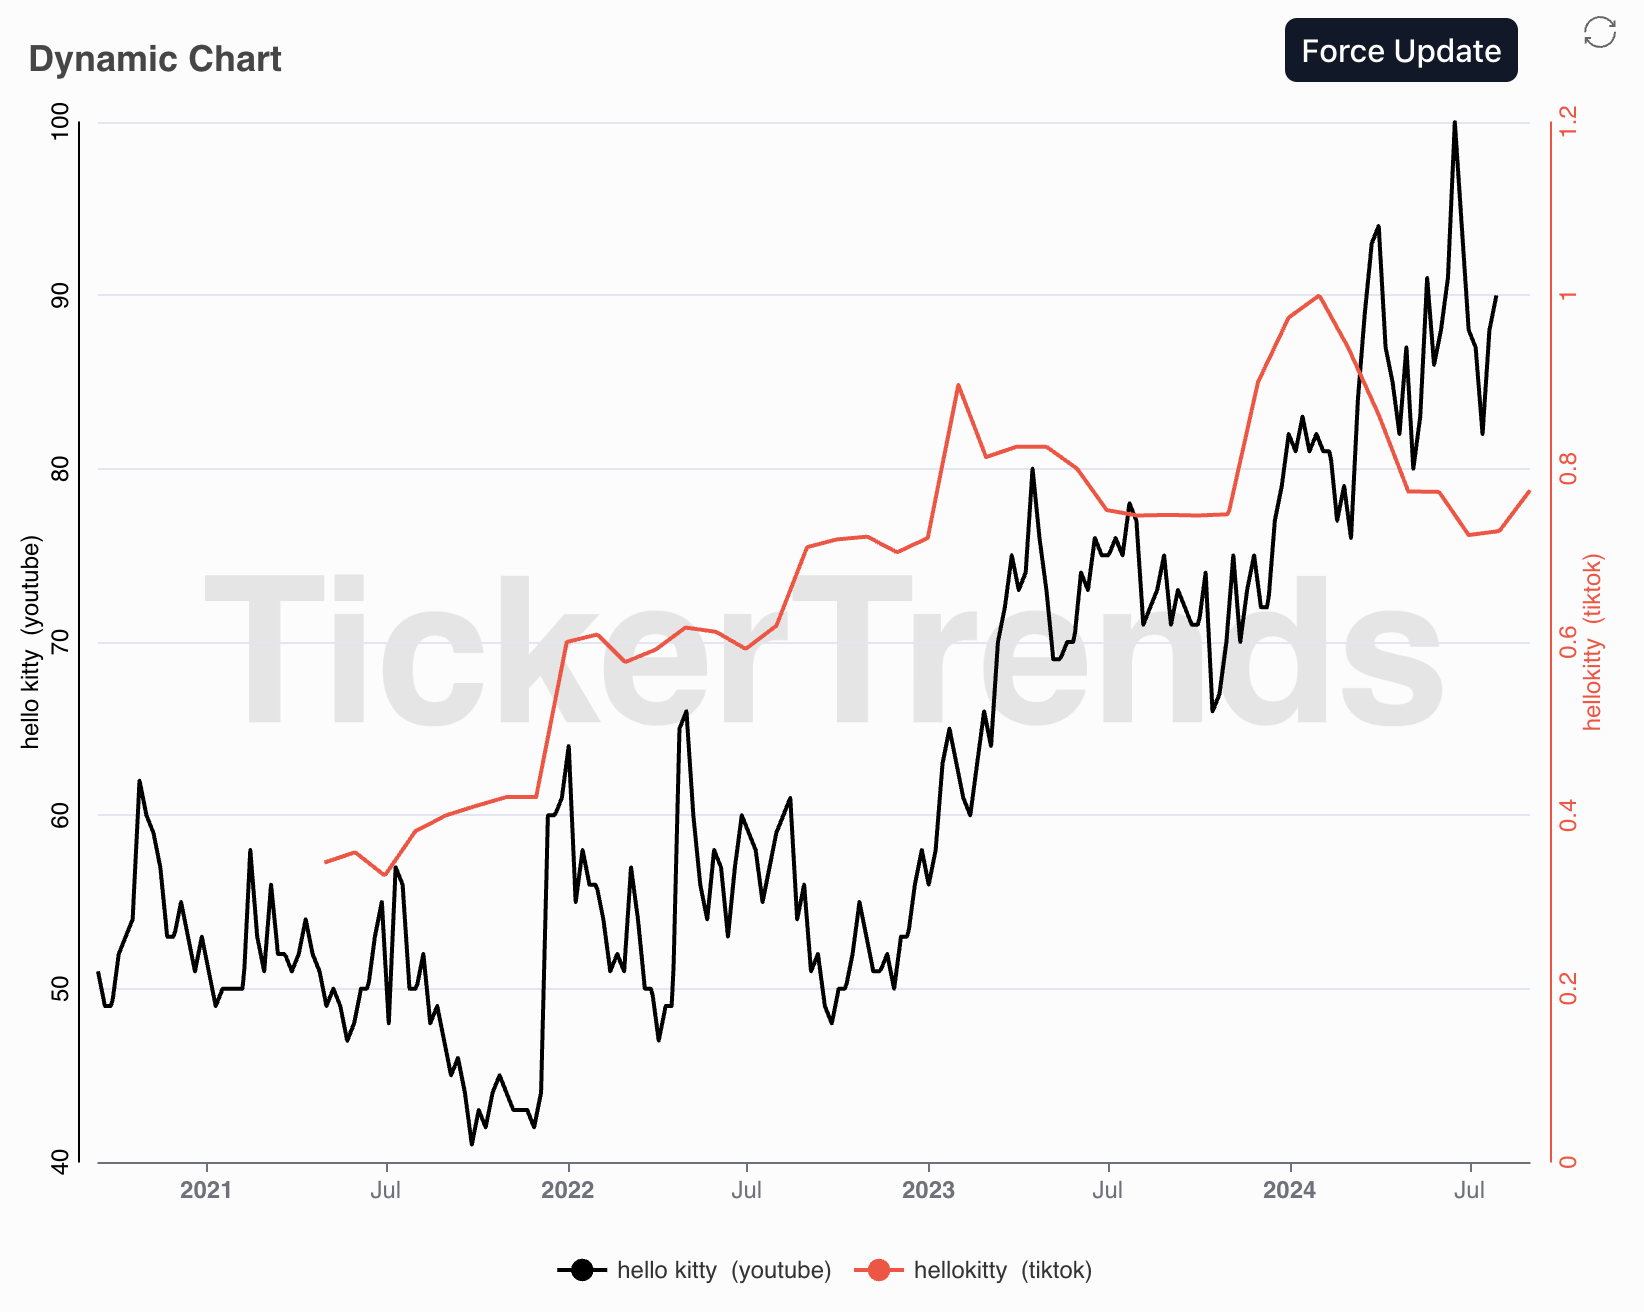
TickerTrends is a new alt-data platform I recently found out through the recommendation of Twitter user MacroValue. It is a paid service but affordable at just US$19/month, giving you access to both TikTok view trends and website traffic. There’s also a more expensive plan at $89/month which provides access to other social media data, including from Reddit, Instagram as well as Amazon search trends and app usage trends. Finally, Tickertrends has a paid Substack newsletter where they highlight how they use their data sets to track the latest fads.
Tickertrends also hosts a Discord chat group where users discuss stocks benefitting from certain trends. Click the “equity arb” tab for the discussion. Just in the past few days, users have been discussing Nintendo (7974 JP - US$63 billion) and Japanese mayonnaise brand Kewpie (2809 JP - US$3.6 billion). You can find the invite link to the Discord group here.
Regarding Hello Kitty, all the data across TikTok, YouTube, Reddit, and Amazon remain constructive. The website traffic to Sanrio.com has dropped slightly over the past two months, but it’s probably too soon to worry. The longer-term trend looks positive.
3.5. Social Blade
What it tracks: YouTube, Twitch, Facebook, Instagram, Twitter, TikTok analytics
Website: socialblade.com
Cost: Free
Social Blade provides social media analytics across platforms such as YouTube, Twitch, Facebook, Instagram, Twitter, and TikTok. While the platform is free, it requires you to register with your own user name.
Unlike TickerTrends, on Social Blade, you’ll need to find the social media accounts you want to track yourself. I typically search for accounts that are large enough to contain a signal among the noise. Small channels can grow quickly, but if a product-related account with 50 million followers is doing poorly, that may be because of the brand itself.
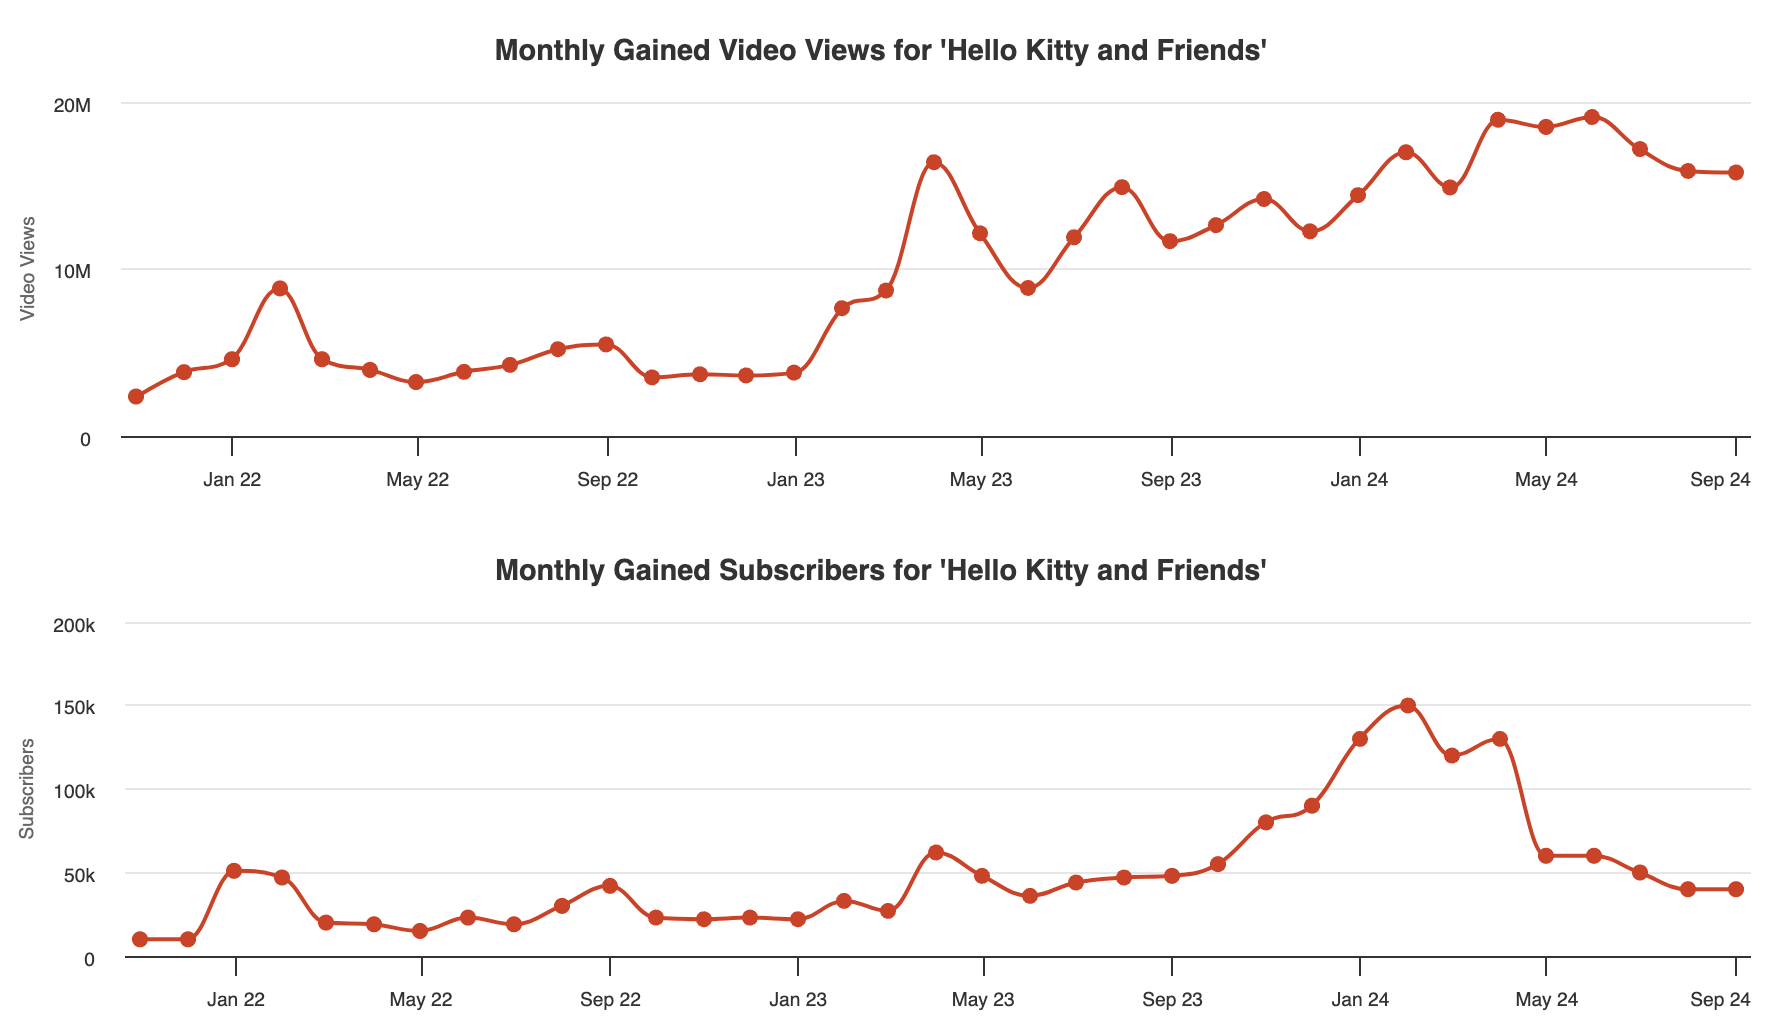
For example, when it comes to Hello Kitty, I searched on YouTube for the brand and found the channel Hello Kitty & Friends. It has 2 million subscribers and content published weekly. I then typed in “@hellokittyandfriends” in the search bar after selecting “YouTube” and was presented with two charts with monthly video views and monthly gained subscribers. The number of video views remains high, though the number of gained subscribers has dropped since late 2023, in line with weaker website traffic.
I then searched on Google for “Instagram Hello Kitty” and found an Instagram account called @hellokitty with 4.1 million followers. The number of monthly gained followers reached a peak in early 2023 and has now dropped somewhat.
Meanwhile, there’s a @hellokitty account on TikTok with 3.3 million followers. According to Social Blade, the number of monthly “likes” on TikTok has dropped since early 2024. It does look like Hello Kitty is still popular, but that it experienced a peak in its viral growth back in late 2023.
3.6. Camelcamelcamel
What it tracks: Amazon product price histories
Website: camelcamelcamel.com
Cost: Free
I like to check second-hand prices for the most popular products because those are determined not by MSRPs but rather by the supply & demand for particular items. If a product is in high demand, you bet that second-hand prices will soon start to reflect this new reality.
Camelcamelcamel used to provide Amazon product rankings but this feature has been discontinued. An alternative data source is Jungle Scout, which I think costs US$29/month.
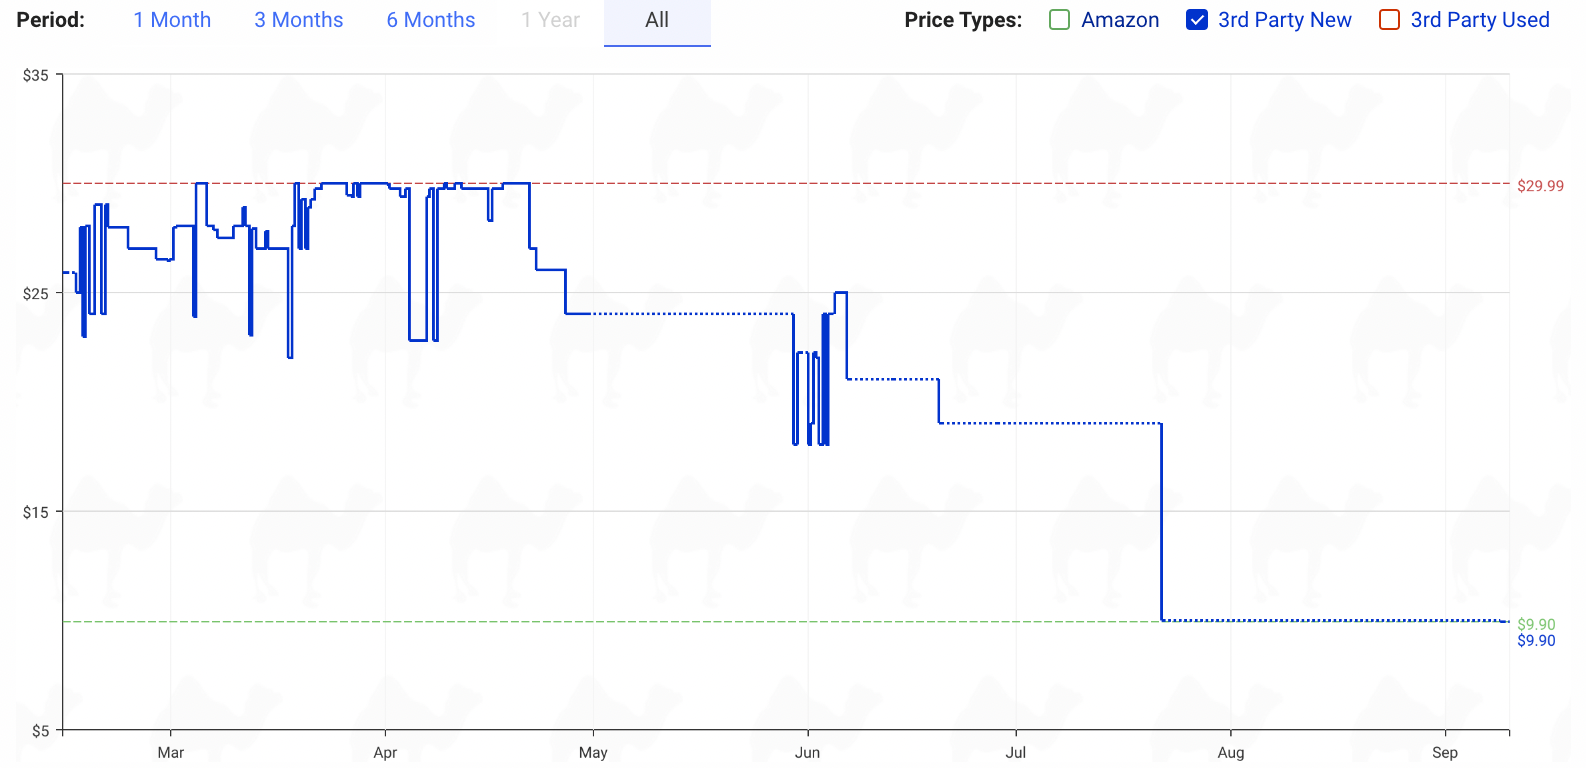
On Camelcamelcamel, the first item that appears when I search for “Hello Kitty” is the Hello Kitty Care Bears plush toy. If you scroll down and click “3rd Party New”, you’ll see this item's second-hand prices. The price has gone down by over half over the past year. This could be due to greater supply or lower demand. I hesitate to draw any conclusion from this data.
3.7. Idealo

What it tracks: Germany product pricing data
Website: idealo.de
Cost: Free
Idealo is a German price comparison website with 10 million monthly active users. Search for a product you want, and then click on it. At the top-right-hand corner of the screen is a price chart. Click “1J” (1 Jahre = 1 year) for a 1-year price history, and you’ll see whether prices have increased or dropped.
To take an example from the Hello Kitty universe, the Jazwares Squishmallows Hello Kitty 30cm plush toy currently costs EUR 24.39 on eBay. One year ago, it cost EUR 24.99.
To me, that data doesn’t contain much signal. But if prices were skyrocketing, then I’d probably conclude that Hello Kitty is in the early stages of a fad cycle. Not the case right now.
3.8. StockX
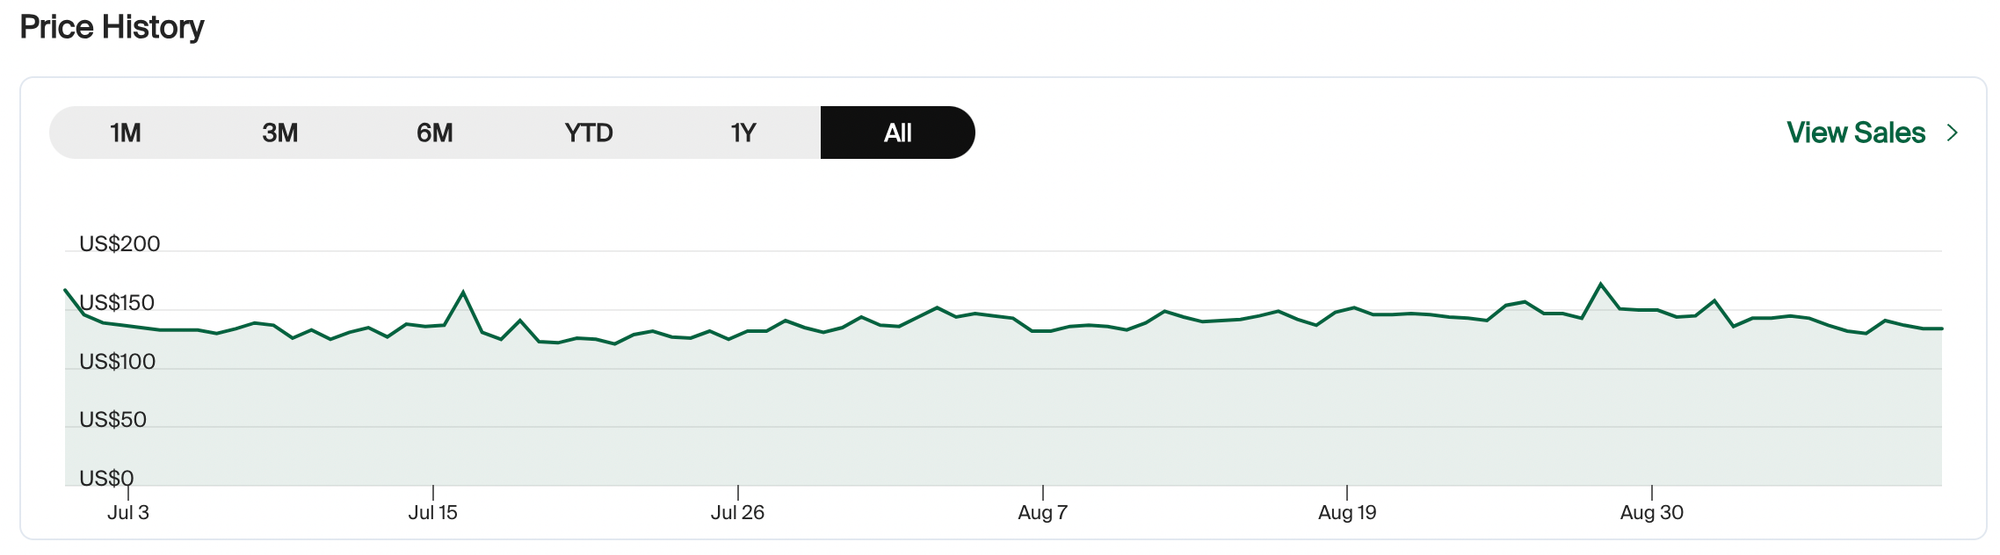
What it tracks: Top prediction market
Website: stockx.com
Cost: Free
StockX is a marketplace for sneakers, handbags, action figures and other collectibles. It’s particularly helpful for analyzing footwear brands such as Nike or Crocs. You can track the prices of particular sneaker editions and see how they have evolved over time. If you scrape data from the platform, you can probably construct price indices for entire brands of products and compare them with each other.
If you search for “Hello Kitty” on StockX, you’ll find a range of Hello Kitty-branded products. They’ve done a host of partnerships in the past few years years, with Nike and others. Scroll down to the bottom and you’ll find historical price charts for each of them. While prices for particular special editions can be volatile, by tracking a number of them you’ll get a feeling of whether a particular brand is popular.
3.9. Data.ai
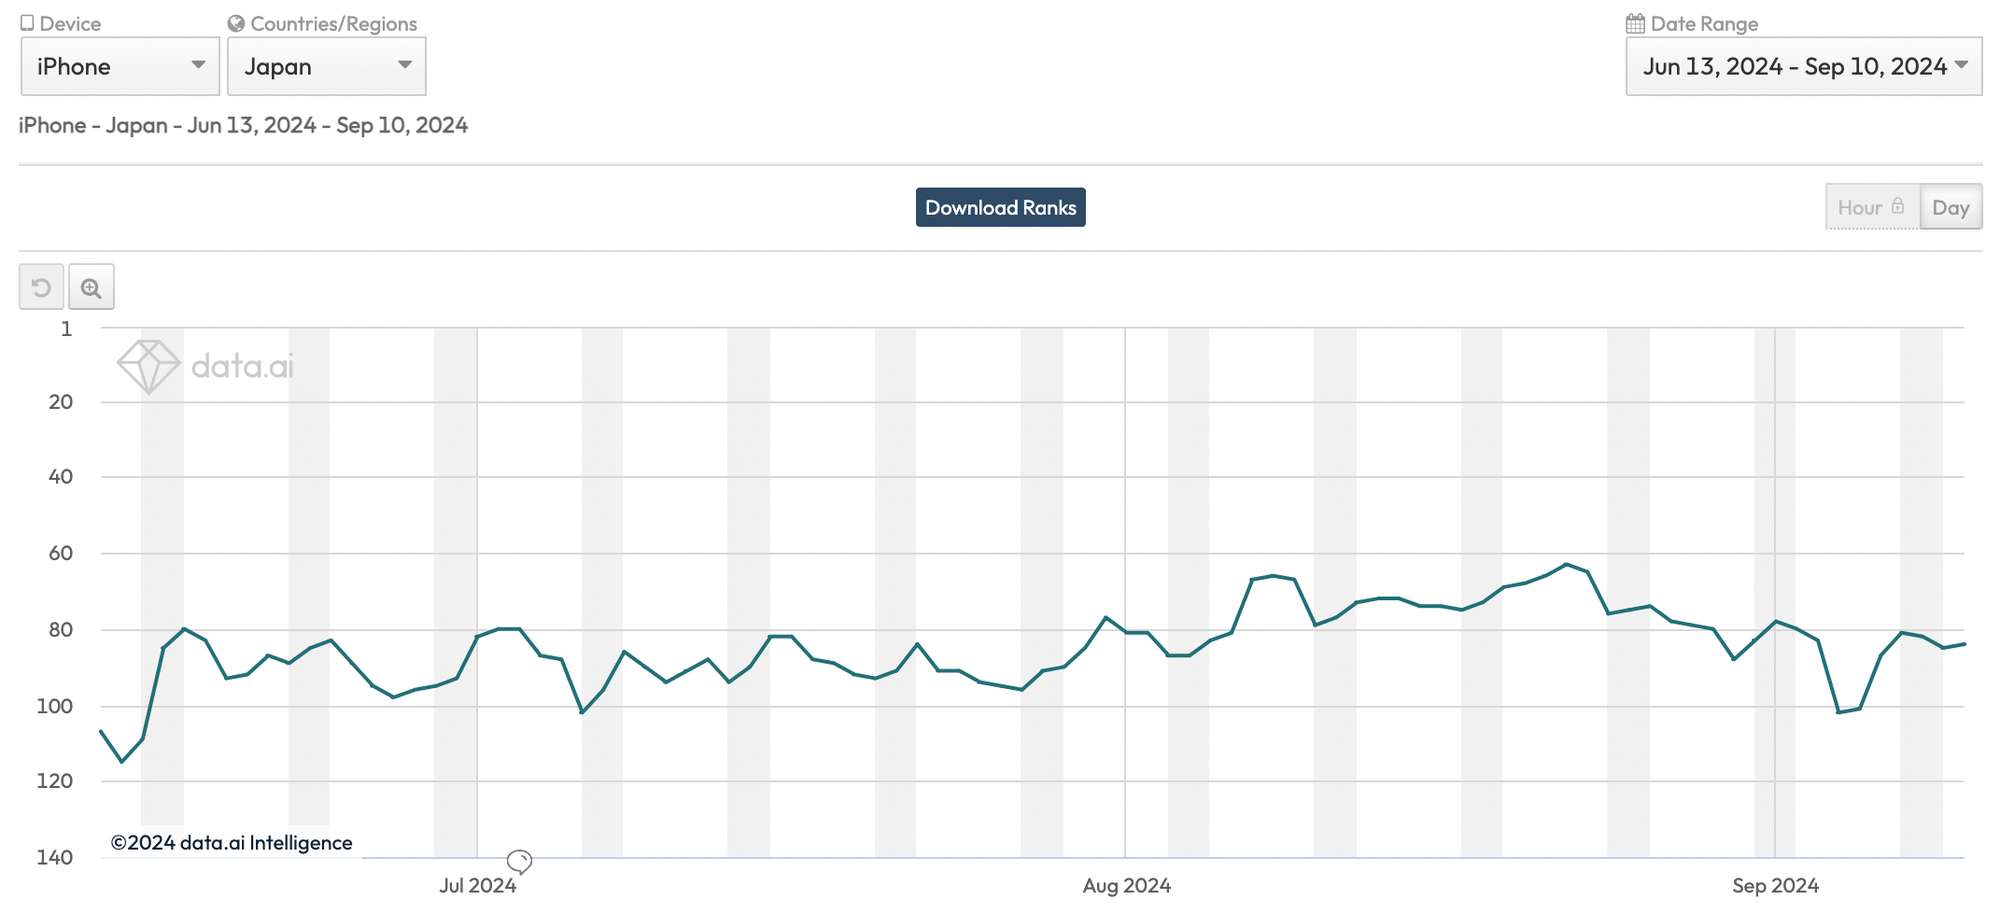
What it tracks: iOS, Google Play app store download and engagement data
Website: data.ai
Cost: Recent app store rankings free, revenue & download data ~US$25-40k/year
AppAnnie and SensorTower used to be the two go-to sources for app engagement and download statistics. They’ve recently merged into one entity called Data.ai, which continues to provide similar services. The free version is limited, but it still enables you to search for individual apps, see how they rank and whether the ranking has changed in the past 90 days.
I usually search for a particular company to see what apps they have developed. In this case, the most important property to measure, in my view, is Sanrio+, the membership app that gives discounts and special deals to Japanese customers.

With limited history, the data provided by Data.ai is not particularly helpful. But if you’re willing to fork up the estimated US$25-40,000 for a full subscription, you can glean insights from their download or app engagement metrics, especially the historical charts that show you how a particular app is trending.
3.10. TwitchTracker
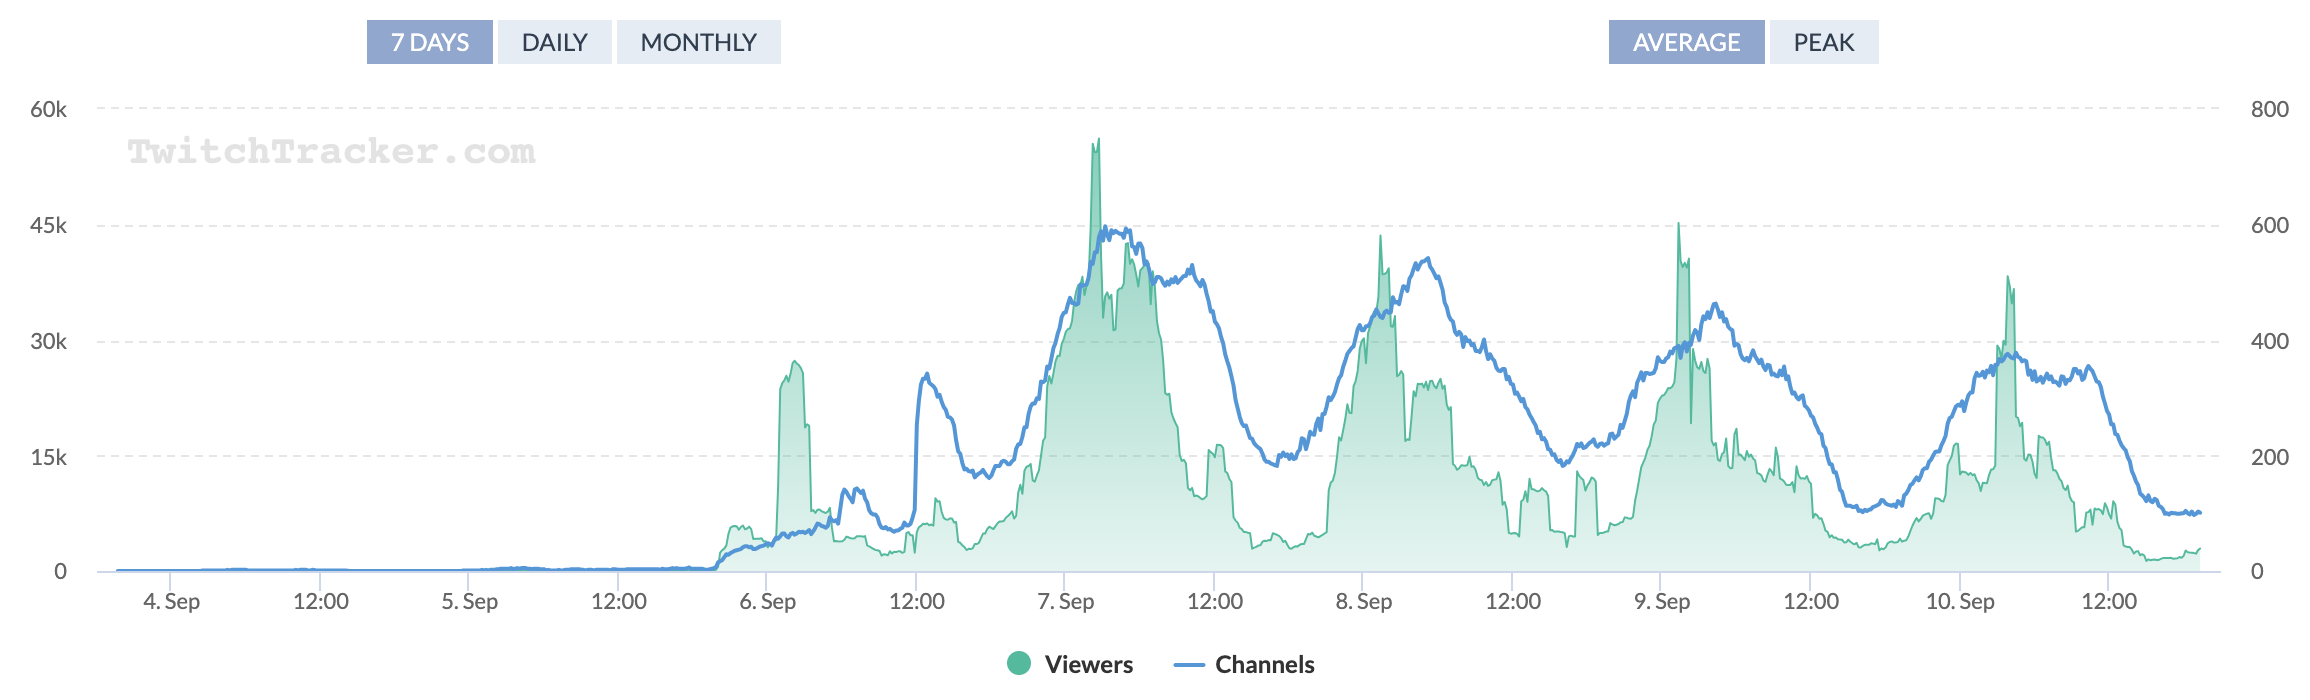
What it tracks: Twitch viewer statistics
Website: twitchtracker
Cost: Free
Twitch is a live streaming platform focused on video games. Users watch live streams where a gamer plays a game while interacting with viewers.
TwitchTracker provides the number of users for each channel at any given point in time. These statistics help you compare today’s viewership to that of other games and historically.
In Hello Kitty’s case, I didn’t find any relevant channels that could help us understand the popularity of the brand. TwitchTracker is mostly useful for tracking video game franchises.
3.11. Steamdb
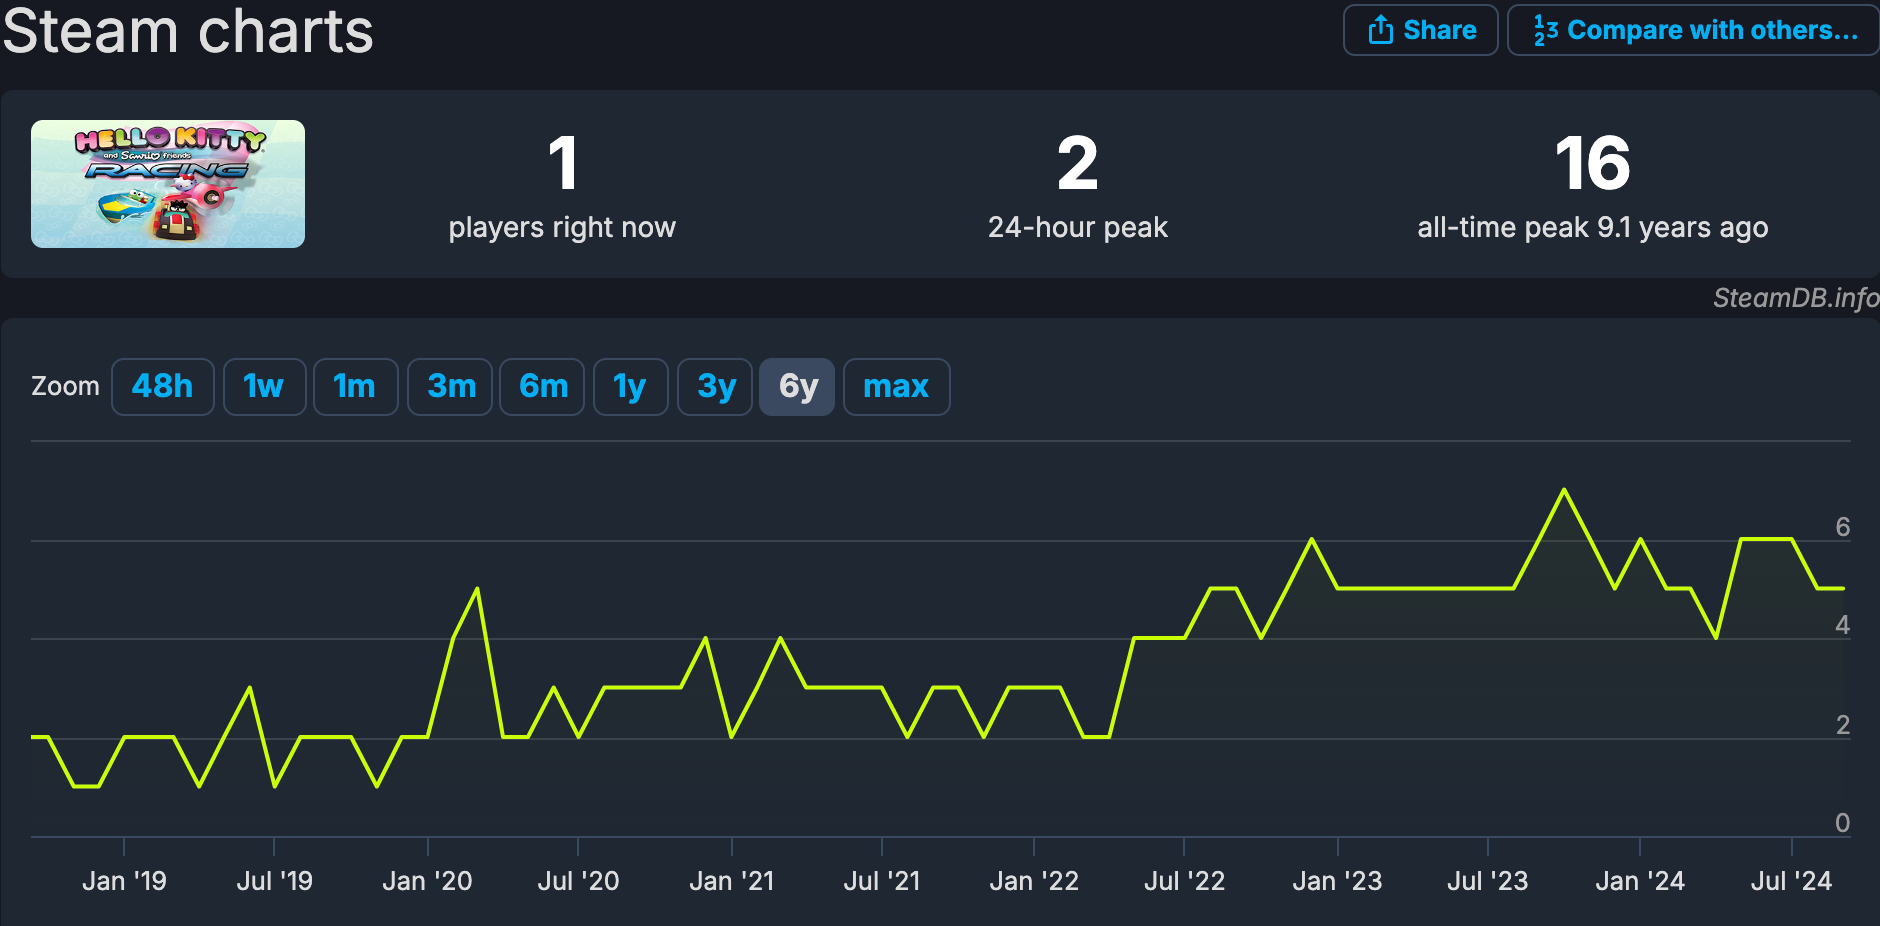
What it tracks: Steam engagement data
Website: steamdb
Cost: Free
Steam is an app store for video games and a platform for playing them. It’s an alternative to the Nintendo, PlayStation, and Xbox app stores.
Steamdb measures user engagement on the Steam platform, so it’s only helpful for games that are actually released on Steam. Search for the game and then click “Charts” on the left-hand side.
The only Hello Kitty-branded game I found was Hello Kitty and Sanrio Friends Gaming. The game only has one concurrent player globally, so this particular game clearly isn’t moving the needle for Sanrio. Had we been analyzing a video game developer, Steamdb would have been more helpful.
3.12. Polymarket
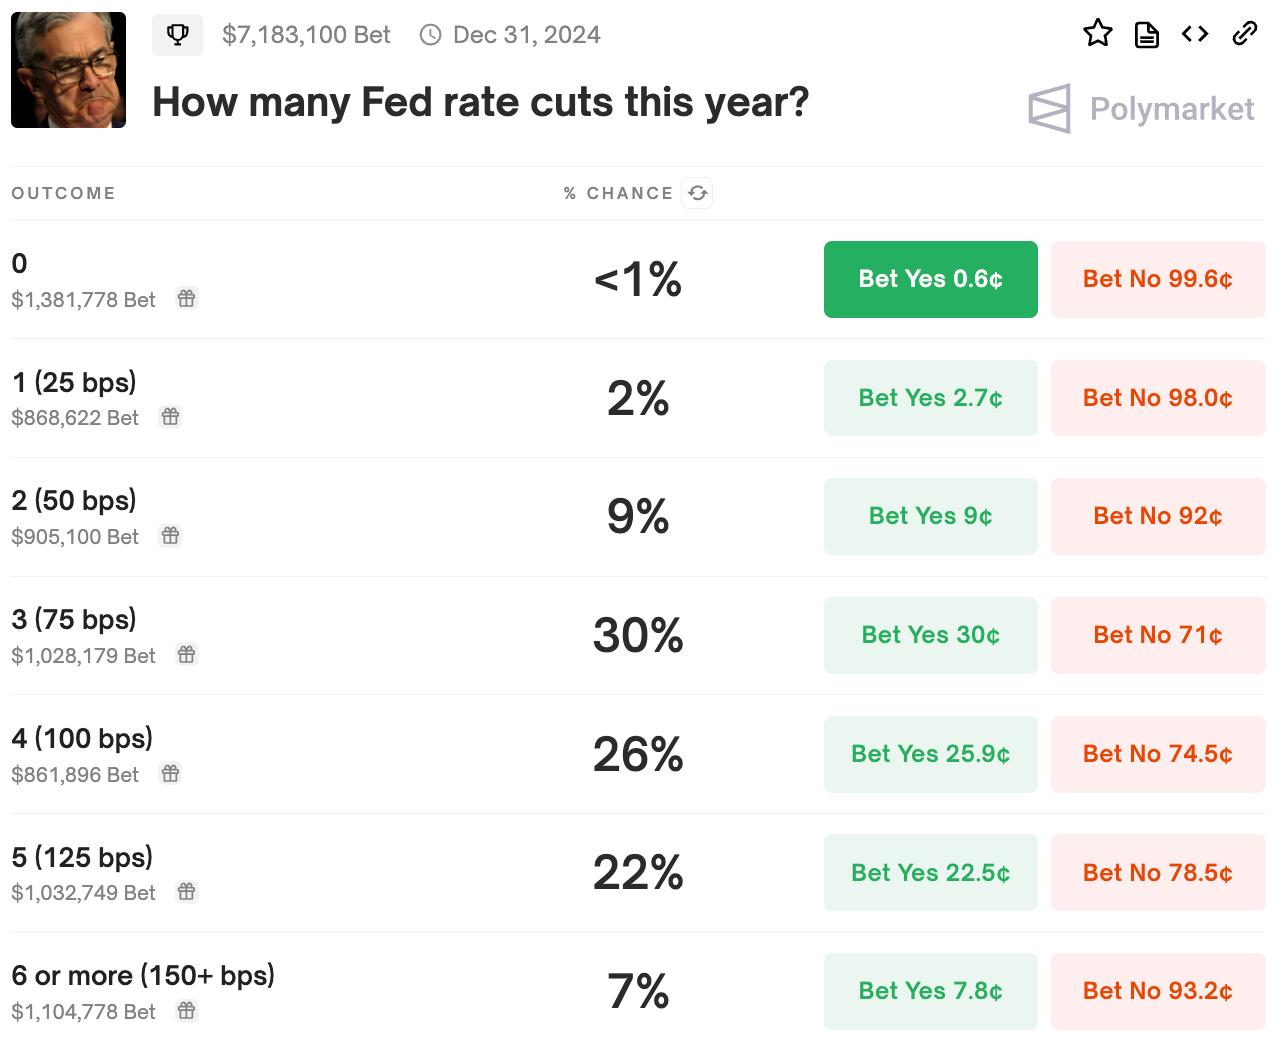
What it tracks: Top prediction market
Website: polymarket.com
Cost: Free
Polymarket is a prediction market where users bet against each other on future events. They deposit money onto the platform and keep their deposits in USDC. They then win or lose money depending on the odds and the outcome of particular bets.
For our purposes, Polymarket is helpful because it provides market-determined odds for specific outcomes.
In Sanrio’s case, there’s nothing that can even remotely help us predict the potential for an earnings beat or raise of guidance. But it can help you understand the odds of broader macro questions.
For example, users on the platform now predict a 75bps rate cut before the end of 2024. That probably means that the Japanese Yen will continue to strengthen, which matters for anyone investing in a yen-denominated asset such as Sanrio.
Conclusion
My number one conclusion from digging into alternative data sources over the past ten years is that Google Trends reigns supreme. It’s incredibly helpful for understanding a product's popularity. In my experience, if a brand's search query index increases exponentially, its earnings are unlikely to disappoint. The only caveat is that Google is not used in certain geographies, such as China, South Korea, and Russia.
I’ve also become a big fan of TickerTrends.io, particularly its YouTube and website analytics.
Toolforge, Subreddit Stats and Social Blade are less helpful, but can also provide additional data points to help support your case.
What alternative data sources do you use? Let me know in the comment section below. And if you’ve spotted any exciting new trends, I’d be curious to hear too: